


Global Commodity Market: Comprehensive Model
Foundations, Fundamentals and Commodity Market Drivers

I have shared a comprehensive model on the Global Currency and Equities market, now the Commodity market is next in line. Other asset class that are of import to me will also follow.
Global Currency:

Equities:

This report serves as a broad based foundational understanding of the Global Commodity market, and not necessarily a full blown substitution for further in-depth reading. In the past I have shared trades on Commodities, prominent one was Sugar, but wasn’t fully active on it, because I have to understand everything I can on the structure and framework of the market then build on that understanding for investment/trading decision.
Sugar Trade:


How this report is structured:
Brief Foundational Narrative
Market Variables
Market Participant
Spot Market
Futures
Term Structure
Basis
Convenience Yield
Backwardation
Contango
Volume and Open Interest
Commitment of Traders Report
Market Index and Options Market
Asset Classification
Hard Commodities
Energy
Metals
Soft Commodities
Grains
Meat
Tropical Commodities
Fiber Commodities
Inter Asset Relationship
Energy Market
Wheat Market
Soybean Market
Crushing Margin
Asset Specific Information Source
Fundamentals
Macro Picture
Macro Regime
Valuation
Risk Premium
Convenience Yield
Positioning and Seasonal Tendency
Micro Picture
Supply and Demand
Agriculture Commodity Report
Livestock Commodity Report
Factor Profile Trading/Investing
Momentum Factor
Basis Factor
Basis Momentum Factor
Skewness
Inflation Beta
Volatility
Hedging Pressure
Open Interest
Generating Discretionary Trade Signals
Trade Discovery & Construction
Risk Management and Leverage Control
Macro Hedging
Things I Read(Books and Papers), That Might Be Useful to You
Brief Foundational Narrative
I aim to not spend a lot of time on some theoretical and historical discourse, the Books and Papers section is available for such extensive reading. Therefore, I will lay critical attention on the key points that I think matters.
At the core of commodities, they enjoy an association of being a Hybrid financial instruments serving the purpose of consumption and processing of goods vital to the economy and also as a financial asset that mostly serves as an inflation hedge, but now increasingly becoming a playground for speculative activity to profit off price swings.
Furthermore, the tenet behind the bull run in commodities, stems from the increase in the rate of industrialization activities by economies globally. Such that as industrialization expand it also spur the demand for commodities which drives the prices of varieties of commodities vital to industrialization. For example, an increase in manufacturing activity would result in increased demand for Industrial commodities such as Copper and/or Aluminum amongst others.
The key takeaway is that growth in economies globally especially the industrial sector is typically associated with the growth in commodities asset prices.
Market Variables
The end goal is to be able to effectively trade commodities as an asset class, and to ensure capability, it becomes vital to understand the structure of the market, particularly from an asset class perspective, without disregarding the hybrid nature being a consumption or processing goods and a financial instrument.
Market Participant
The commodities market is primarily made up of two market participants:
Hedgers
The Speculator
Hedgers are participants whose primary motive in engaging within the commodities market is to protect their interest from a Sales or Purchase point of view on their production/business activity.
Recall the Hybrid nature of commodities, in the real economy there are producers of commodity assets and also consumers/more appropriately users of commodity assets. Each player would like to protect their interest as follows:
The Producer would like to sell their commodity at the highest possible price for profit gains well above their cost - Short Hedge
The Consumer/User would like to purchase the produced commodities at the cheapest possible price - Long Hedge
Due to the unique interests of each Hedging parties, they by default take a natural position of being short or long always. The producer would by default take a short position to sell the commodity at the highest possible price, while the consumer would by default take a long position to purchase the commodity at the cheapest price.
However, in the context of where we are so far into this report, the hedgers can only do this effectively in the Futures market and not the Spot market.
Spot Market
The Spot market is similarly referred to as the Cash market, where instant purchase and sales of the underlying commodity take place with the notion of immediate delivery of the asset. E.g. if you pull up the Spot of Cotton and you execute a long trade, it essentially means you are buying Cotton at the spot price and with immediate exchange of the commodity.

However, the spot market does not exactly serve the purpose of a producer planting Cotton and expected to harvest 3 months down the line, and also a Textile Processing plant, that need to stock up its inventory for production 2 month into the future. They do not have a need to execute at the spot market to take immediate delivery of the underlying asset.
Futures Market
The Futures market came about as an evolution from the Cash market for varieties of reasons. The futures market serves the need of the Hedger such that the underlying commodity product becomes standardized with different delivery period denoted in calendar months:

The above image shows the Orange Juice runs for both the Spot and Futures market all the way forward into May 2027. The futures market is quite useful to understand perception of demand and supply imbalance since it reflects to a large extent the activity of producers and users of the underlying contract.
E.g. if I operate a Orange Fruit Juice processing plant and I have an information edge that the prices of Orange Juice would appreciate by Jan’2025. To protect myself against the increased additional cost, I would hedge my needs by purchasing the OJF25(Jan’25) contract at the current price, and what this implies is that at the delivery date, I would receive a certain quantity(15,000 pounds per contract traded) of the underlying commodity.
However, if I do not wish to receive the underlying commodity, I would have to close my position before the delivery date.
Futures - Term Structure
Similar to the bonds market, where you have a Yield Curve that provides insight into the future expectations on the direction of interest rate across varying maturities, in the Futures market for commodities we also have a curve that provides insights on the future expectations of the prices of the underlying commodities, which provides some view on the supply and demand situation of the asset.
Before delving deeper into the type of term structure I would like to touch briefly on the concept of Basis.
Basis
Basis is the price difference between the Spot and a Futures contract. Referencing the Orange Juice contract runs, the Cash price was trading at 426.00s while the next future contract being July’24 was trading at 432.75 and the Sep’24 contract was trading at 437.05.
The Basis between the Cash price and the July’24 contract is 6.75, while the basis between the Cash price and Sep’24 contract is 11.05. The basis between each contract relative to the cash contract reflects information on the following:
Storage Cost
Insurance Cost
Transportation Cost
Financing Cost (Tbills rate)
Convenience Yield
All of the above cost is mainly associated with holding inventory of the commodity for future delivery. However, what is really important to note is that the increase in Basis between the Spot and a Futures contract is associated to an increase in any of the above components, which also has its impact on the price of the commodity.
The variables that account for the increase/decrease in Basis are quite self-explanatory, except for Convenience Yield.
Convenience Yield is the non-monetary benefit of holding the physical commodity rather than the futures contract, with the notion that there are advantages from having physical possession of the commodity for immediate use.
The rule of thumb for the Convenience Yield is as follows:
The Convenience Yield increases as inventories of the underlying commodity reduces
The Convenience Yield decreases as inventories of the underlying commodity increases
In a nutshell, the Convenience Yield provides some form of insights into the scarcity/availability of the underlying commodity, which also filters into the Basis and also the term structure.
With the basic concept and components of basis explained, we can proceed to the types of Term Structure for a commodity.
Backwardation and Contango
Backwardation occurs when the spot price is higher (expensive) than the subsequent futures contract down the curve. While Contango occurs when the spot price is lower (cheaper) than the subsequent futures contract down the curve.

A backwardation term structure is an indication of a high risk premium or anticipated decline in the spot price, hinting at a future expectation in distortion of supply/demand imbalance.
While a Contango term structure is an indication of a potential surplus of the commodity, with no expectation of a large change in supply and demand imbalance.
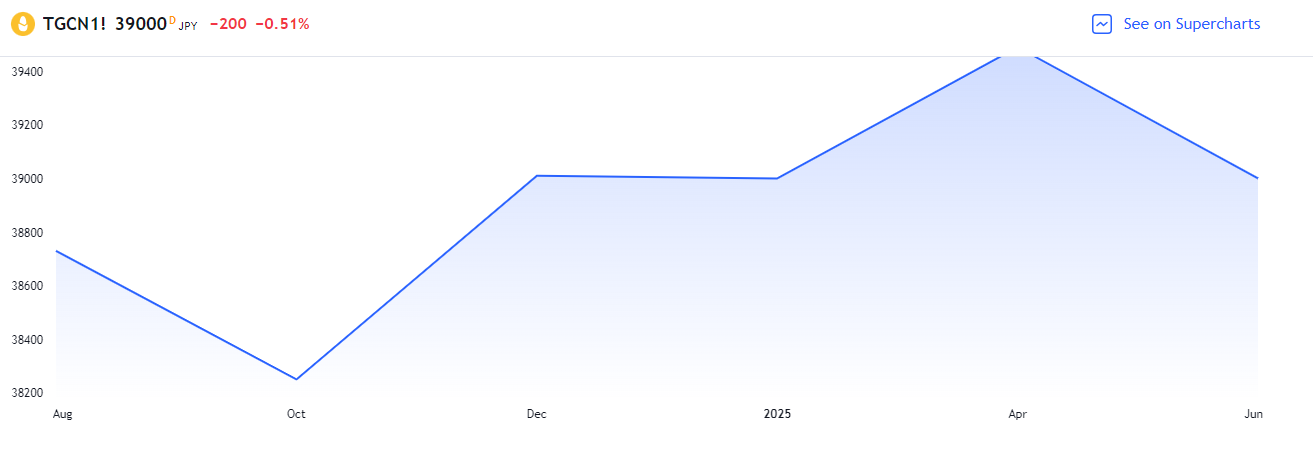
The above Term Structure for Corn has a mix of Backwardation up until October and a Contango up until April contract.
The Term Structure in itself is not a sufficient signal for trade decision, it provides some insights, however, it is useful to have a proper framework to contextualize the rationale behind the current term structure.
Volume & Open Interest
Volume and Open Interest variables also provide additional context on the activity/behavior of market participants. The Volume data provides insight on the market activity of both buy and sell orders

The important tool to complement Volume information is the Open Interest(OI) tool. The open interest indicates the number of contracts that are active and outstanding. OI provides insights on the activities of long and shorts positions, such that it increases when new long position meets existing shorts and decreases when existing long position sells to an existing short position.
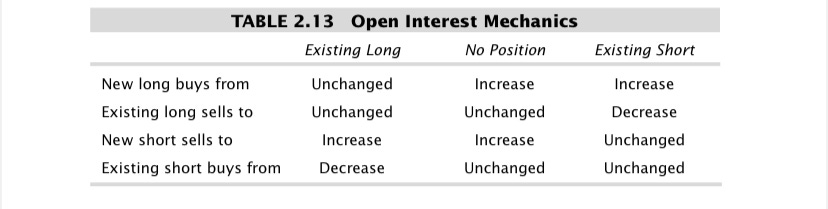
As a rule of thumb, it is best to actively trade the contract with the highest volume and open interest, which in this case is the Sep’24 contract.

Utilizing the OI mechanics, price action, appropriate context and narrative unlocks the value of using OI.
Commitment of Traders Report
The COT report in addition to Volume and Open Interest also provide additional information on positioning of market participants:

The COT chart provides information on Commercials(Red), Large Speculators(Green) and Small Speculators(Blue). The technique to reading the data is to sort of segment the data as a stacked histogram with a zero divisor line such that when the line is above(below) zero positioning is Long(short).
A bit more details on the COT Report, the Commercials positioning are information on the hedging position of Producers and Processors. The other group are Non-commercials which include large speculators such as Banks and Hedge Funds, whose primary objective is to speculate on the price of the underlying asset.
The focus is on analyzing the net position of the Commercials and Non-Commercials. When the net position of the Commercials are net long, they are hedging against a potential increase in the price of the underlying asset and vice versa when they are net short.

CME has an advanced tool for visualizing COT report, yet to wrap my head around it, but I have been using the COT data from CFTC and Barchart for the past 4 years. I would probably write a mini report on how to use the COT report subsequently.
Market Index and Options Market
There are quite a number of Commodity Market Index, core focus is the FTSE/Core Commodity Index. The index is rebalanced monthly by rescaling the percent return for individual commodities and below is the allocation:

The Options market serves as a useful instrument in gauging the market’s future expected risk of the underlying product. What I find more useful currently is the use of Implied Volatility derived from the options and underlying product which is used to contextualize expectations around expected or realized volatility of the asset.
CME Group has a CVOL index for different products that is accessible for free:

Bloomberg Terminal also has a function VCA<GO> that provides a detailed view on Volatility and Correlation:

The central tenet around this is trying to measure expected volatility in price movements of the underlying asset relative to average and historical data, coupled with the realized volatility, and the VCA dashboard provides information on that.
The options market is a deeper rabbit hole, but what I pay attention to is the implied volatility which is an expectation of a likelihood of a move in the price of the underlying asset, the higher the implied volatility the higher the expectation of a swing movement in price and vice versa. While realized volatility is the actual trading volatility of the asset class.
The key is to able to contextualize what factor could drive implied volatility higher or lower for the underlying asset, and how that impacts the trade you are running.
Asset Classification
This section just involves the proper classification of the various commodity asset under the right bucket:
Hard Commodities:
The hard commodities are made up of assets that are not renewable in nature, with limited availability in the long run and this include Energy and Metals.
Energy commodities are vital engine behind industrialization and consumption, and the sub-products include:
Crude Oil
Natural Gas
Unleaded Gasoline
Heating Oil
Coal
While Metals are classified as Industrial and Precious Metals:
Industrial:
Copper
Aluminum
Precious:
Silver
Gold
Platinum
Palladium
There are more commodities under each components, but my focus is mainly on the actively traded ones.
Soft Commodities:
Soft commodities are renewable in nature with specific period for planting and harvest. They are classified into Grains, Meats and Softs, with their sub-components as follows:
Grains:
Wheat
Winter
Spring
Red Wheat
Corn
Soybeans
Soybean Meal
Soybean Oil
Meat:
Live Cattle
Feeder Cattle
Lean Hogs
Softs:
Tropical Commodities
Coffee
Sugar
Cocoa
Orange Juice
Fiber Commodities
Cotton
Lumber
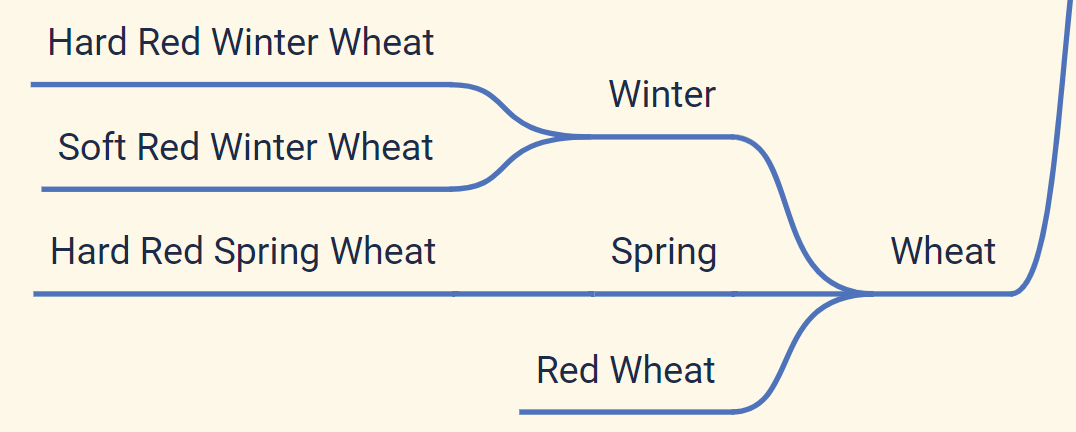
Wheat
There are different types of Wheat commodities based on its planting season and it hard & soft varieties.
The Winter wheat is planted in the fall and harvested in the spring or early summer, and it includes Hard Red Winter Wheat which is used for Bread & All-Purpose flour, and Soft Red Winter Wheat used for Cakes, Pastries and Crackers. Its growing conditions is typically in mild winter seasons.
The spring wheat on the other hand is planted in the spring and harvested in late summer or early fall, with primarily a hard varieties. The Hard Red Spring Wheat is known for high protein content, used for high-quality bread and baked goods. Its growing conditions is primarily during harsh winter.
The last type being Red wheat is planted both in winter and spring, with a variety of both Hard Red Winter Wheat and Hard Red Spring Wheat.
Meat
Meat similar to Wheat also has different types. The Live Cattle refers to fully grown cattle that are ready for slaughter, and they are typically sold by weight and are often processed into beef.
Feeder cattle are younger cattle that have been weaned from their mothers and being raised primarily for future slaughter, a growth stage into Live Cattle.
Lastly, Lean Hogs refer to pigs that are raised specifically for meat production that are sold to processor who produce pork products.
It is pertinent to understand the sub-types of the commodity product as they offer insights into inter-asset analysis and how to express trade ideas. I will touch on this briefly.
Inter Asset Relationship
As previously mentioned there are significant relationship that exists between commodities, and how it is important to understand these relationship to aid in effectively constructing a trade view across the sub assets.
Energy Market
From an Energy market perspective, there exists significant relationship between Crude Oil, Gasoline and Heating Oil. Gasoline and Heating Oil are derived from Crude Oil, hence there exists pass through effect between the three commodities.

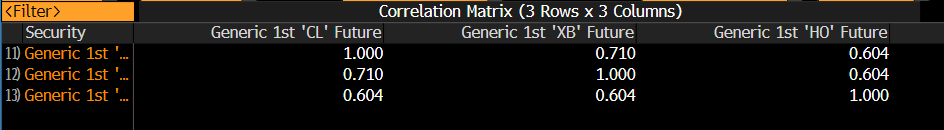
There is at least a 60 -70% daily correlation between the three commodities. Hence, it is useful to try to understand which of the commodities would express a long/short view more.
In addition to core energy products, I would also like to briefly mention a potential correlation between Corn, Sugar and Soybeans primarily due to the fact that they are alternative energy source for Ethanol. Hence, it might useful to check the relationships here, but I personally think if you want to make a energy play stick to the energy products.
Wheat Market
There are different varieties of Wheat product, due to the planting and harvesting season. Hence, depending on the period we are positioned in on the calendar and supply/demand imbalance, it is useful to watch how all the varieties of product are trading and the market sentiments behind it, then ultimately relating it to the core product being Wheat itself.

The above shows a relatively strong correlation between Wheat and all its varieties. The more insightful way to utilize the varieties is to measure the inter-contract spread of the different varieties then utilize the information into the underlying Wheat active contract.
For example, if the basis between the planting month and the harvesting month of Hard Red Winter Wheat and Soft Red Winter Wheat is high, it could imply a potential supply imbalance due to say low harvest or some other factors, as a result I could long the Wheat contract now and a hold a long term position into the HRW and SRW harvest season as I expect that supply imbalance to result in increased price due to higher demand.


Soybean Market
The Soybean market has derivatives which include Soybean Meal and Soybean Oil, which takes place by the Crushing of Soybean itself. However, the cracking mills try to optimally decide which of the product should be focused on for extracting and this is mostly determined by the Crushing Margin.
The Crushing Margin refers to the profitability of crushing or processing the raw materials (Soybean) into Soybean Meal or Soybean Oil. This margin is crucial for crushers, processors, traders and farmers as it decides where to allocate resources to which is also driven by demand expectations.
To determine which asset to trade either long or short relative to the Soybean, simply divide Soybean by each sub-products being Soybean Meal and Soybean Oil. Here is an example:
Soybean Price: $1,121
Soybean Meal Price: $329.20
Soybean Oil Price: $47.91
Soybean($1,121) has been on a downtrend with dwindling prices for the producers, therefore if a crushing activity is to take place, the crushing mill needs to decide which of the by-product should resources be allocated to
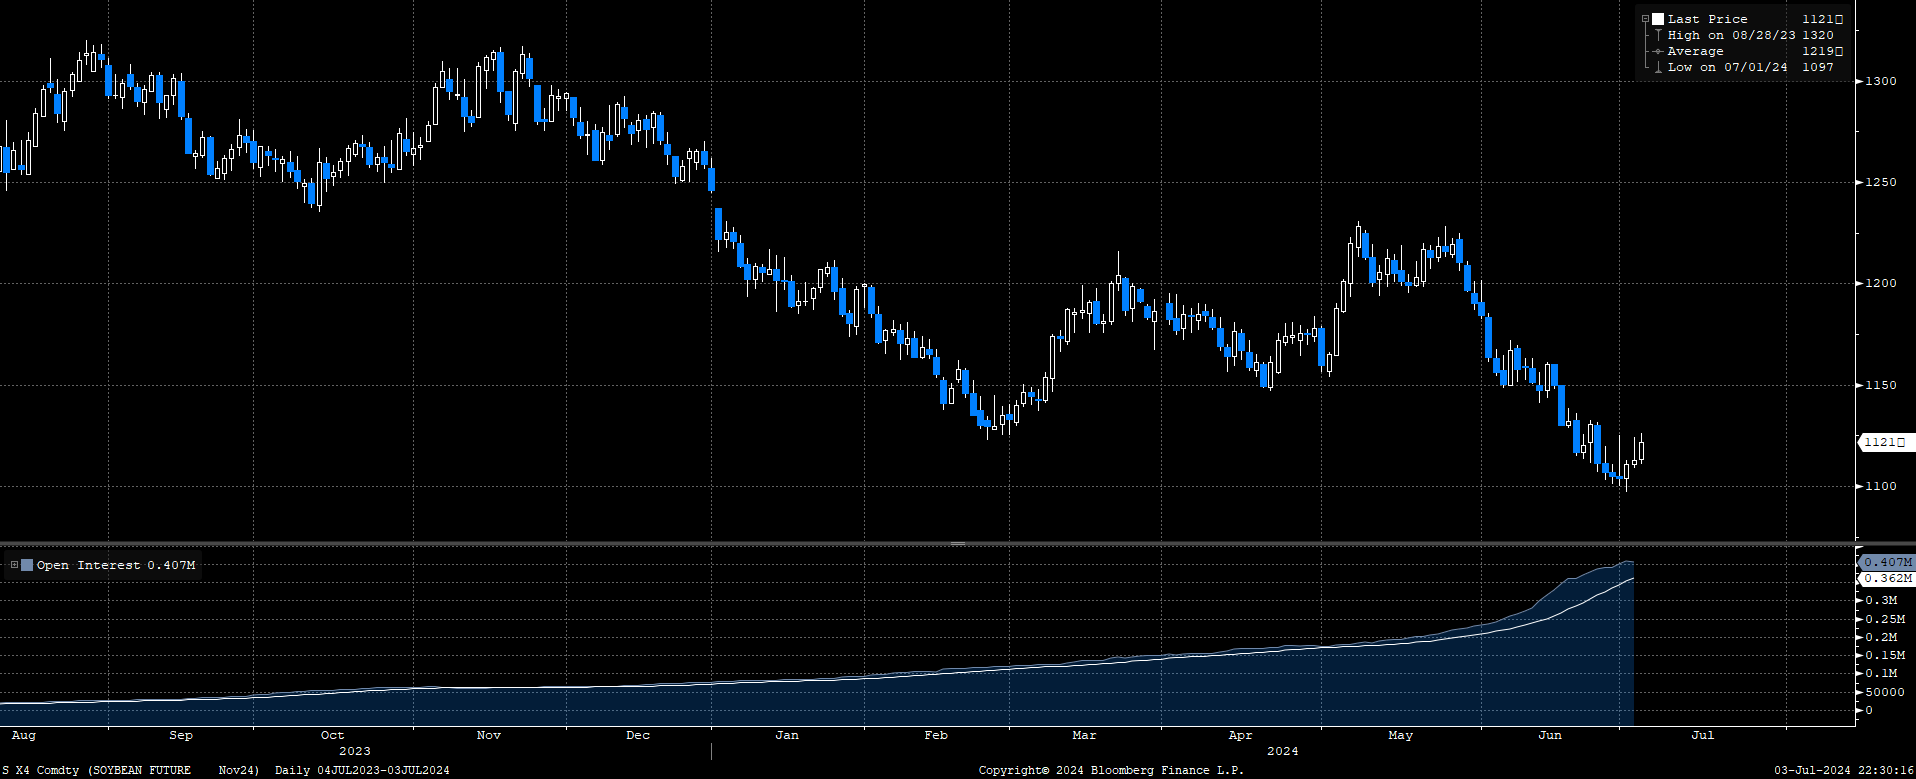
Here I have a ratio of Soybean and Soybean Meal, with an increasing margin of 3.4067

While the ratio of Soybean and Soybean Oil, has a declining margin of 23.4085

What this implies is that if I am buying Soybean and Selling Soybean Meal, I potentially enjoy an upside, while If I am buying Soybean and Selling Soybean Oil I potentially run at a declining value to the trade. Hence If Soybean is weak(strong), the better short (long) trade would be in Soybean Meal(Soybean Oil) and not Soybean Oil(Soybean Meal).
This is expressed visually below:

Asset Specific Information Source
For the Grains and Soft Markets, below are information source to focus on:

For the Energy Market:

For the Metal Market:

So far so good, we have been able to lay proper foundation for trading the commodity markets, now we go deeper into what moves the market and how we can utilize fundamental information for developing a bias for specific asset.
Fundamentals
Macro Picture
As always it is important to understand where we are in the Macro cycle as activities in the commodity market is directly linked to activities in the broad economy. We are already familiar with our GILPTS model I have shared in previous reports:

Growth
The only slight tweak to the GILPTS framework is our point of focus in the economic variables. As stated in the introductory aspect of this report, growth in commodities stems from Industrialization, as a result under the growth regime, our focus is on evaluating growth in the manufacturing sector and industrial production, as this provide insights into an increase(decrease) in the demand for commodities.
Inflation - Expected and Unexpected
The other variable being inflation is also a critical factor. Commodities are attributed as inflation hedged financial securities against inflation. However, there are broadly two types of inflation when it comes to commodities which are:
Expect Inflation
Unexpected Inflation
Recall, that part of the components of Inflation is Food which are inherently commodities. However, if Inflation is expected or priced in, we might not see that move in price reflect in the commodities market.

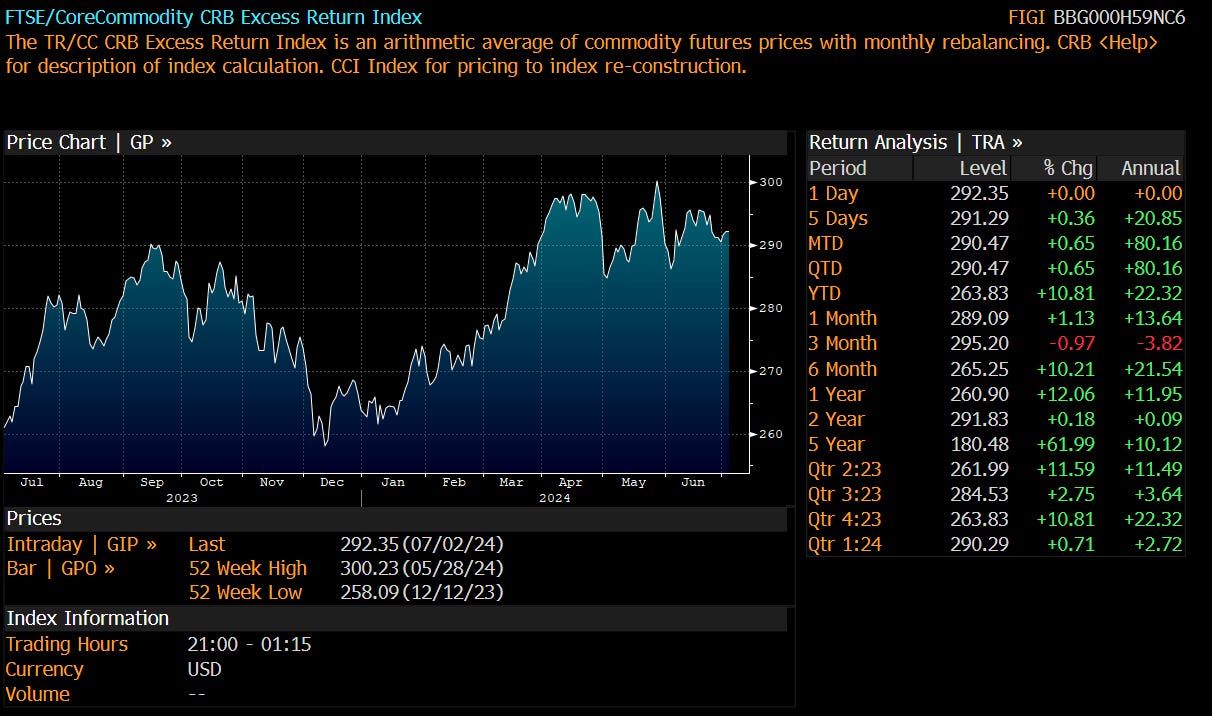
In 2020, there was an increased correlation between the prices of commodities and rising inflation post COVID19 pandemic. We see that relationship persist until inflation peaked in 2022:

Subsequent to CPI peaking and declining, there has been a broad based decline in the CRB index, but however not as significant as the rate of decline in inflationary pressures. Despite inflation staying lower and range bound since Dec 2023 till date, we are experiencing some upward pressure in the CRB Index.
It is important for me to note that an increase(decrease) in this index doesn’t exactly translate to increase (decrease) in all commodities, a step further has to take place by decomposing the index members to identify where the pressure persist from.
Monetary Policy/Interest Rate
Furthermore, Monetary Policy/Interest Rates also has its impact on the commodity market, due to its direct impact on consumer spending. If consumer spending is constricted due to a contractionary monetary policy, we would most likely see a reduced demand for commodities and vice versa.

In 2020, Interest Rate was at its lowest, coupled with a Quantitative Easing monetary policy, evident by an increase in the US Fed balances. The combination of lower rates and increased money supply contributed to the increase in commodity prices.

In 2021, the US Fed pivoted on its balance sheet expansion, while commodity prices were still rallying. However, as the hawkish rates regime ensued, the commodity market peaked and declined subsequently. Now, market sentiment is skewed towards a rate cut, and commodities are pressing to the upside.
Currency - Dollar Effect
Commodities are mostly priced in US Dollar(USD) as a result there is a relationship between USD and Commodities. Such that when the value of the USD depreciates, producers would require an additional premium on the prices of commodities to account for the decline in the value of the trading currency and vice versa when the USD appreciates:

Now, there are times when this correlation lose its track but even during such times, there are appropriate context and/or narrative that provides insight into that. The overall point behind the currency effect is to assess the impact on Purchasing Power, Investment Flow into the USD as a Safe Haven and Global Economic factors, all of these has to be permutated to understand the dominant driver and its implications for commodities.
Risks
Geopolitical, Economic and Financial risk also has its impact on commodity prices. In 2020/2021, we had the Russia-Ukraine war that drove energy and agricultural commodities higher, similarly in 2024 we have the Middle East Tensions that initially sparked some premium for energy commodities.
The VIX index can be effective in tracking any perceived risk premium in the market, similarly the implied volatilities for each market can also be tracked.
In conclusion, the combination of these macro regimes will provide insights as to whether we are positioned for a potential upside or downside in the commodity market.
Valuation
The focus around valuation here isn’t to bore you with some financial model like the DCF, which obviously isn’t applicable to commodities. The focus here is build a framework for thinking of commodity price relative to two factors, which are:
Risk Premium
Convenience Yield
I already touched on Convenience Yield and briefly on Risk Premium. The point is that in the process of analysis on the commodity asset there are two narrative; one is the risk premium, whereby the value of the commodity is based on the expected future spot price discounted by a risk premium. Contextually the risk premium can be attributed to any macro thesis or event from the fundamental analysis which would build a perceived expectation on if the asset price sufficiently reflects such risk premium event.
The other factor is on convenience yield, which is more related with supply and demand factors, and how that is also reflected in the prices of the commodity. Succinctly, the expected price of the commodity should be constructed from a combination of both risk premium and the convenience yield.
Positioning and Seasonal Tendency
I already touched on positioning analysis through the use of COT reports, Volume and Open Interest. Seasonal Tendencies would be the central focus here.
Seasonal Tendency basically refers to the patterns or trends in commodity prices. I find this useful especially for agricultural commodities, since every year is a cycle of planting and harvesting, albeit impacted by other factors such as Weather and the Risks factor highlighted earlier on. However, Seasonal Tendency analyzes historical data, with a minimum of 10 to 15 years back and provide a possible trend/pattern of the market in the present.

The above seasonal tendency report, provides a map for the likely direction of wheat in specific months, this has to be applied with the right context and a narrative. For example, in May, there is a bullish seasonal tendency and subsequently in June a retracement is anticipated but overall the seasonal tendency is bearish in June

In 2024, early in May we see a similar move in line with the seasonal tendency and a decline in June without a retracement. Seasonal tendency is an effective tool to use in the commodity market, but it is not to be used in isolation.
Micro Picture
With a narrative or thesis in place from the macro view, the trade idea isn’t complete until the evaluation of specific reports around each asset class to provide insights on the supply and demand situation.
I won’t be able to go into all the reports detailed, else I might as well turn this report into a mini e-book. I have already provided the information source for all the commodity asset class, in this section I will just share a map on the key information to focus on, and in subsequent report I will delve deep into them.
On Crops/Agriculture products the focus is primarily around the following reports/variables and the end goal is to try to assess if there is excess supply, shortage in supply, more demand or less demand.

For Livestock:

Now, you can see how that’s a lot of moving part for me to breakdown in this report.
Factor Profile Trading/Investing
Once you are able to build your thesis on the Macro and Micro picture, then you can start to utilize some factor profiling criteria, similar to how I explained it in the Equity market reports.
For commodities the factor profile are:
Momentum
This involves trading assets that are currently experiencing some momentum attribute on the long/short end, you can utilize a momentum indicator criteria to screen out assets that fall within a pre-defined criteria e.g commodities trading above 30 day high etc.
Basis
I already touched on basis, and how it relates with the term structure. The higher the basis between the spot market and futures contract, then there is a likelihood of an increased risk premium, hence this can aid in selecting commodities that fall into this criteria.
Basis Momentum
Basis momentum is simply the combination of the basis factor and momentum factor.
Skewness
Skewness is a measure that quantifies asymmetry of the distribution of returns for the underlying asset. The skew for an asset could either be negative or positive.
The skew is positive when the average return may be higher, with an increased probability for large positive return and negative when the average return may be lower with an increase probability for large negative returns.
For example, if I have a long view and solid thesis around Livestock, I would select an asset with a positive skew, cause it could offer the probability of a higher positive return than executing a long on a negative skew security. But they both have to fit into the same fundamental context for expressing the trade idea.
Inflation Beta
This simply involves trading commodities that have a higher sensitivity to inflation data. A commodity asset that exhibits high inflation beta would be a good trade during inflationary period and the inverse during low inflationary period.
Volatility
Volatility factor would be to trade the underlying asset in line with the implied volatility behavior such that, you maintain a long position in commodities with lower volatility and short position in commodities with higher volatility.
Hedging Pressure
This involves the analysis of the COT report, then executing a long trade on commodities with more directional hedging pressure.
Below is the Commercial Net Positioning for Wheat. Commercials have been on a long hedging position, with significant pressure on that end as they potentially anticipate a decline in the prices of wheat.

Open Interest
The use of open interest has been touched on, simply utilize the open interest mechanics shared and build a criteria for a long/short position based on the movement of open interest.
Overall, I find each factor interesting to use, but I would personally apply a multi factor approach depending on my trade thesis especially on the Macro picture.
Generating Discretionary Trade Signals
I have shared to some extent enough information for a trader to build multiple models around specific asset in the commodity market based on some discretionary or systematic criteria.
I run all of my trading on discretionary signals, some part of the model are a bit systematic but the process to performing the market analysis is largely discretionary.
The main take away is, you should be able to synthesize all the information towards discovering where a trade opportunity exists, and constructing your views into specific markets, e.g you might have a macro view that supports a long commodity market trade, the next stage is how you intend to express that idea. Would the trade opportunity be better maximized by playing in the Grains or Livestock market or even the energy market? then which specific products do I want to trade, this encompasses the process of trade discovery and construction.
Building upon trade discovery and construction is obviously managing risk and the leverage utilized to take a bet on an idea. If you have an opportunity to hedge the trade, you can also do that. For example if I have a long trade idea on Soybean Oil, I could hedge the trade by shorting Soybean or Soybean Meal at the same time, but there also has to be sufficient context to why you are hedging and how to.
Things I Read, That Might Be Useful to You
If you made it here, glad to know you dedicated time to go through it all. A bit of a personal reflection is to always frame the question appropriately in mind, I have quite a number of questions (market and life related) that I need information from books, papers, texts to be able to develop sufficient knowledge and/or foundation in other for me to formulate a model that I think might work best for me to resolve the question. However, a better model would be a model that works for everyone - a net force for good for all parties.
At the end of the day, it simply drills down to the willingness to want to dedicate time to reading, studying, extracting the information and synthesizing it. One thing to note is that when you read across all the materials in the same domain, they almost say the same thing just in different expressions, however, there are few insights that you get to lean on which you won’t find in reading just one or two materials, so keep that in mind as I share all the resources I read to be able to flesh out the comprehensive model for the commodity market.
Commodity Derivatives: Markets and Application by Neil C Schofield
https://www.nber.org/system/files/working_papers/w18569/w18569.pdf
https://www.elgaronline.com/view/journals/ejeep/20/3/article-p515.xml
https://www.rba.gov.au/publications/confs/2009/pdf/frankel-rose.pdf
https://www.elibrary.imf.org/display/book/9781557754127/ch003.xml
https://www.bauer.uh.edu/spirrong/Pirrong_storage_book_101115.pdf
https://www.econstor.eu/bitstream/10419/86120/1/659434911.pdf
https://researchrepository.wvu.edu/cgi/viewcontent.cgi?article=1113&context=rri_pubs
https://climateimpact.edhec.edu/sites/ercii/files/factor_based_commodity_investing.pdf
https://www.cmegroup.com/articles/2024/understanding-major-usda-reports.html
https://www.cmegroup.com/tools-information/quikstrike/commitment-of-traders.html
News Release:
Statistics and Calendar:
That will be all on the Commodity market front, so far so good, I have shared comprehensive models on three asset class: FX, Equities and Commodities. Future reports would build on them and with more focus on generating the trading signals.
I have no special talent, I am only passionately curious.
this is a great read!! amazing job
this is a good one and important to what i’m currently pursuing. will be diving deeper into this later today.