


Macro Pulse: September
Soft Labor Market, Recession in Play?

Towards the end of the month of August, I shared my views on where I think we are across the macro regime, and my sector focus within the equities market:

This would be an abridged version focusing on this week price action, economic data release and my thought process on how to position ahead.
Sector Flows

The equities market experienced broad sell off across sectors, however, less dominant in Utilities, Real Estate, Consumer Staples. While Technology and other sectors saw selling pressure into the end of the week.
In the previous report, I emphasized my focus on increasing exposure to Real Estate and Utilities, while reducing exposure to Technology & Information, Industrials and Consumer Discretionary, and so far that has been the best positioning, and not being caught off-side by the sell-off this week.

However, the reaction to the market to recent data release requires me to re-evaluate positioning and finding new plays for the month of September.
Seasonal Tendency
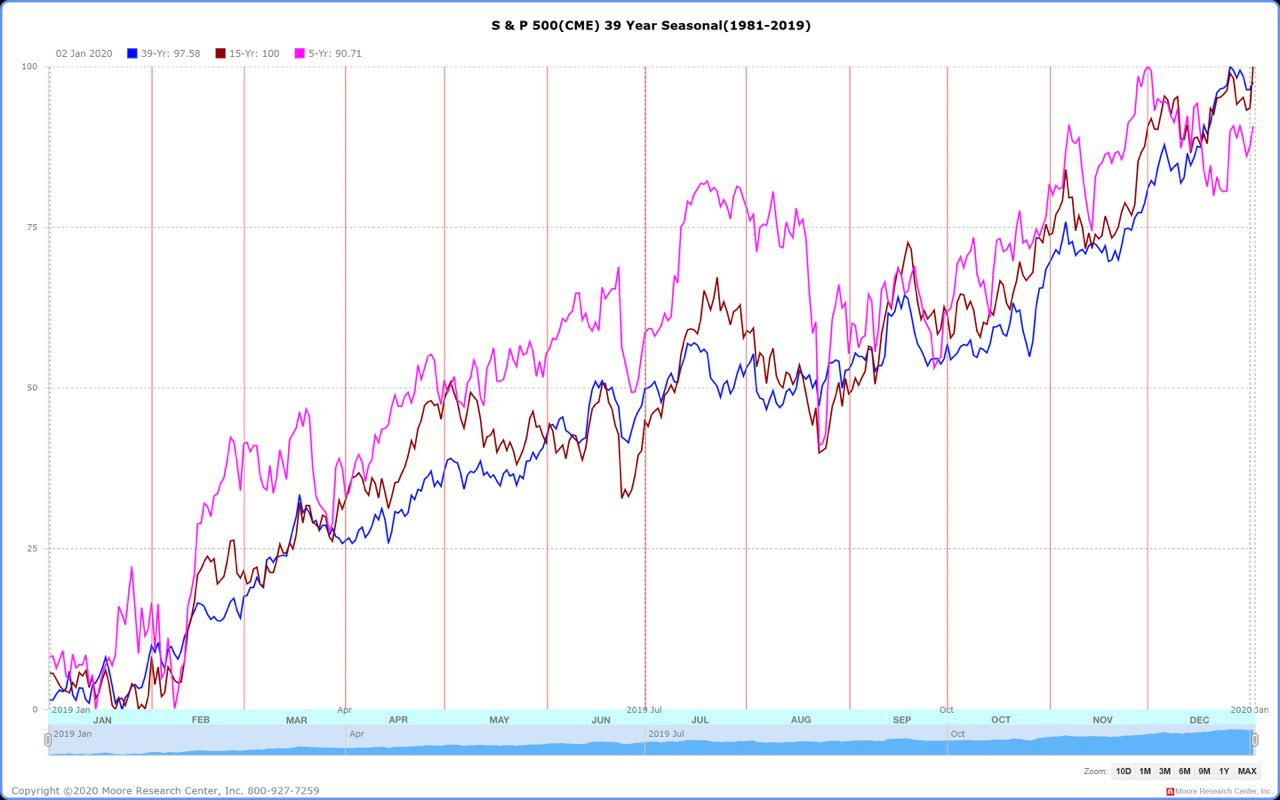
September is typically the month with bearish seasonal tendencies for equity indices, if you are curious about headlines like this:

Seasonal tendencies do work, but it is best used when other factors supports a bearish narrative, because an asset has a bearish(bullish) seasonality, doesn’t outright mean you should short(long) the underlying, it is just one factor in the mix of things.
Economic Data and Macro Regime
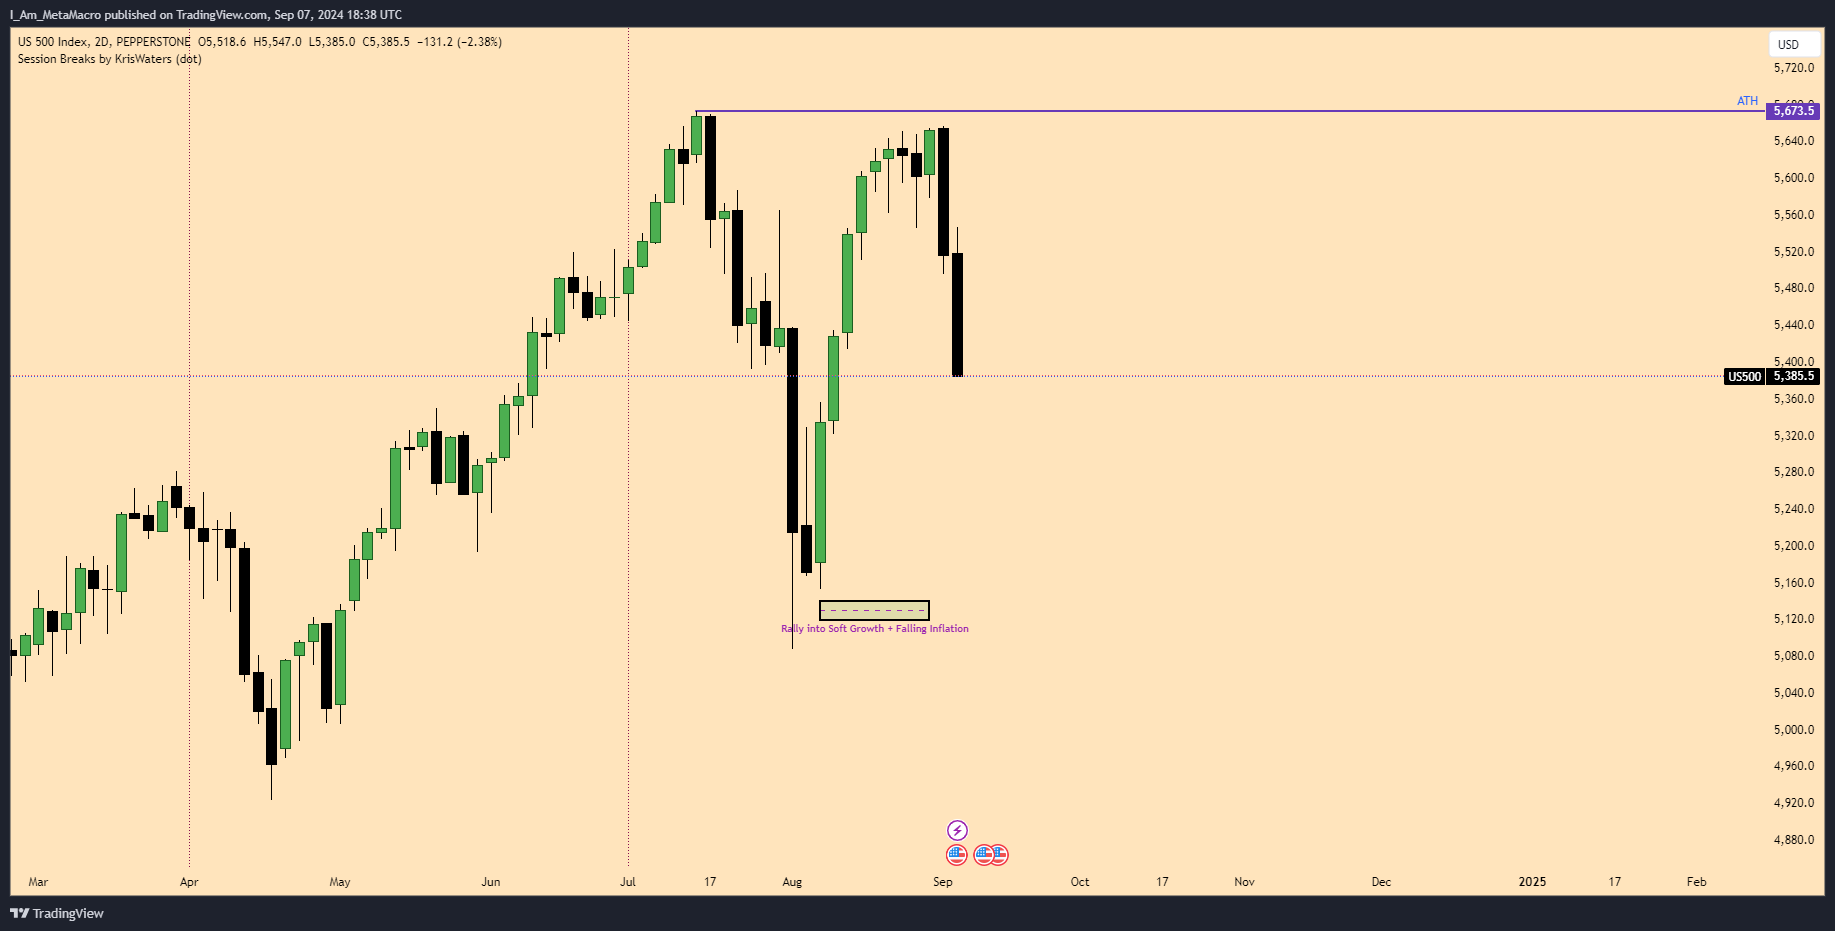
The macro regime the market seems to be pricing has been a case of positive growth and falling inflation, which has contributed immensely to the bull run we experienced post the volatility shock from JPY Carry trade unwind:
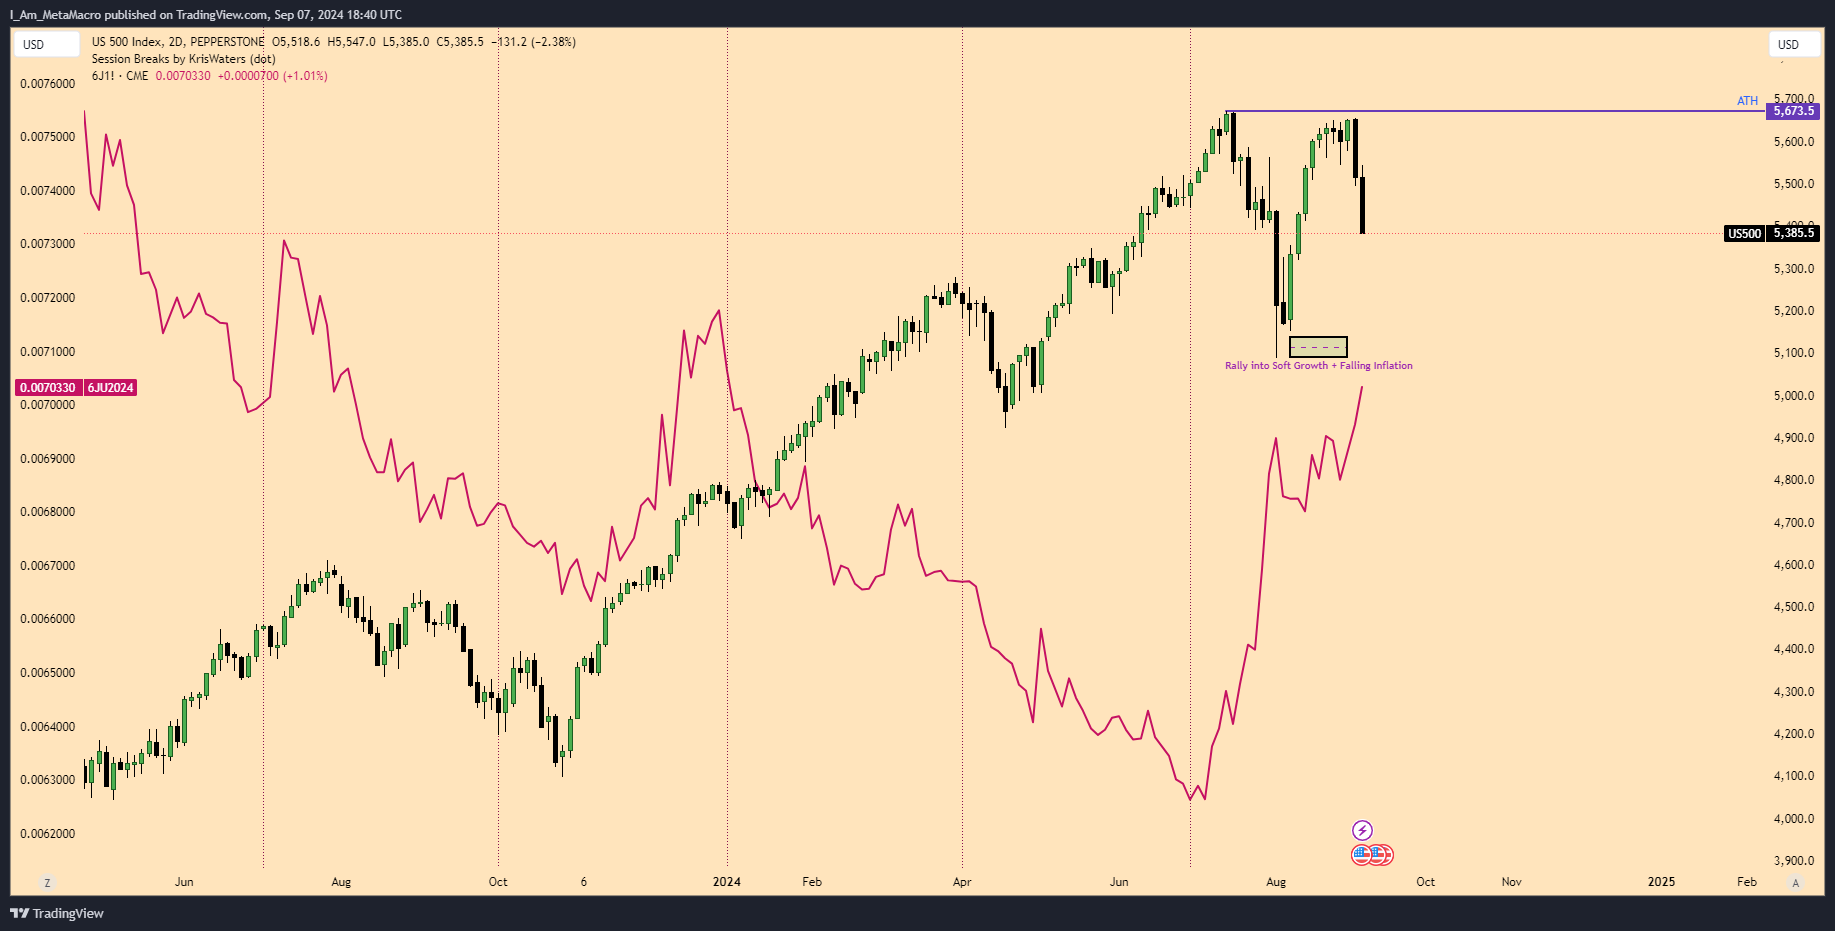
JPY Rallying as S&P declines, could be a contributing factor to why the S&P declined, yeah maybe but could it be the cause, can’t say for sure absolutely - trying not to mistake correlation for causality.
If you were running a new strategy around shorting the S&P as Yen rally, you made money sure, but I try not to think about the markets from one dimension, nonetheless, I was flat and only exposed to Utilities sector which rallied through the week as the market sell off:
One question to ask around the JPY carry trade unwind is its implication around credit risk, and if that risk is actively dominant in driving positioning across the Equities market.
However, into the week my thought process was primarily around how the economic data prints, then to re-assess my stance on the cyclical sectors while holding Utilities to enjoy the play from defensive growth and falling inflation. Hence, my focus primarily would be evaluating the fresh set of economic data and monitoring credit and liquidity risk, then forming positioning ideas.
Economic Calendar
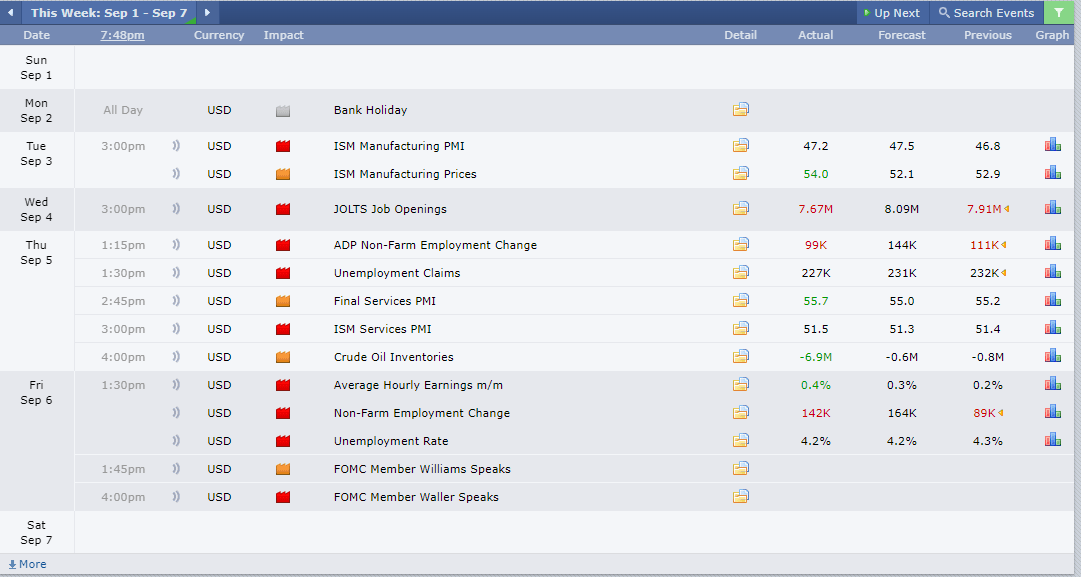
While the equity market rallied close to breaching historical highs, the question for me was - will the market breach its ATH in a period where macro data seems to be slowing down especially with the market pivoting focus to the labor market? Hence, the need for more data to to provide clarity to that question.
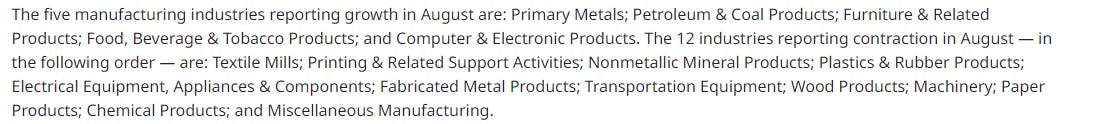
ISM Manufacturing PMI was positive relative to the last print, but below market expectations. The manufacturing sector is contracting, with companies focus on uncertainty due to current Fed policy and election uncertainty.
In the Labor market, Jobs Opening contracted to 7.67M below market expectations to 8.09M. On a MoM basis, Hires increased by 5.2%, Separations increased by 6.61% and Layoffs increased by 12.95%. On a moving average basis, the Jolts Job Openings data indicates a contraction in the labor market. For the past 6 months, the performance of Job openings has been mixed, however July data actually indicates a contraction in this segment of the labor market:

However, Unemployment Claims continue to decline on a week on week basis, despite broad slow-down in layoffs and discharges. The data here still point towards a mixed status for the labor market.
Lastly, NFP data added 142k jobs compared to market expectations at 164k addition. The NFP data still reflect a slight increase compared to July and June on a MoM basis, albeit a slight slowdown on a YoY basis. Overall, it is not an explicit negative recessionary contraction, but a slowdown, with unemployment rate also declining to 4.2% .
In view of the economic data, Fed member Waller spoke on monetary policy path, and here are some key highlights for me:
Balance of risks has shifted toward the employment side of our dual mandate, and that monetary policy needs to adjust accordingly.
A second point is that, setting aside the unusual circumstances of the 1981–82 recession, recessions occur when a major shock hits the economy. In the absence of a big negative shock, an inversion of the yield curve or a triggering of the Sahm rule doesn't necessarily mean we are entering a recession
Cutting the policy rate at a faster pace means a greater likelihood of achieving a soft landing but at the risk of overshooting on rate cuts if the neutral rate has in fact risen above its pre-pandemic level. This would cause an undesired loosening of monetary policy.
If subsequent data show a significant deterioration in the labor market, the FOMC can act quickly and forcefully to adjust monetary policy.
Meshing all the information together, what’s the possible path ahead?:
On the data front, the labor market is slowing down, but not at a pace that would result in say >50bps cut which the FI market is pricing in.
Secondly, the question for me is how the market reacts to the rate cut when it finally takes place, it does seem like the market is over-reacting to the softening data on growth and labor market, now interpreting soft/relatively bad data into bearish price action.
However, the market could price in a rate cut as a bearish trade, with the presupposition that we are cutting into a weakening economy from labor market data, which could first result in a further slowdown before a rebound due to lag effect, I think this is primarily the concern that the market is pricing in.
The concern around JPY carry trade unwind might be valid, but credit spreads do not indicate a significant credit risk event that could result in a market crash, the initial shock from the carry trade unwind took place, any further increase in Yen, at least without a corresponding increase in rates by BoJ which we are yet to see still keep things subtle, credit spreads are not in an area of concern compared to historical recessionary levels:


I will continue keeping an eye on credit spreads, also running some models to notify on any drastic changes on the credit risk side of things, and to track Japan economy, but the trade is primarily in FX.
In summary, on the macro basis, bias is mixed, but bullish? Yes, but the market seems to be reacting negatively to softening data despite anticipated rate cut, but on the Macro Regime, growth is Rangebound between Positive and Mixed, but not recessionary, this pendulum between both ranges require active management in establishing position on both spectrum of the curve, and the next section delves into some microstructure on how I intend to position for that.
Equities Drivers
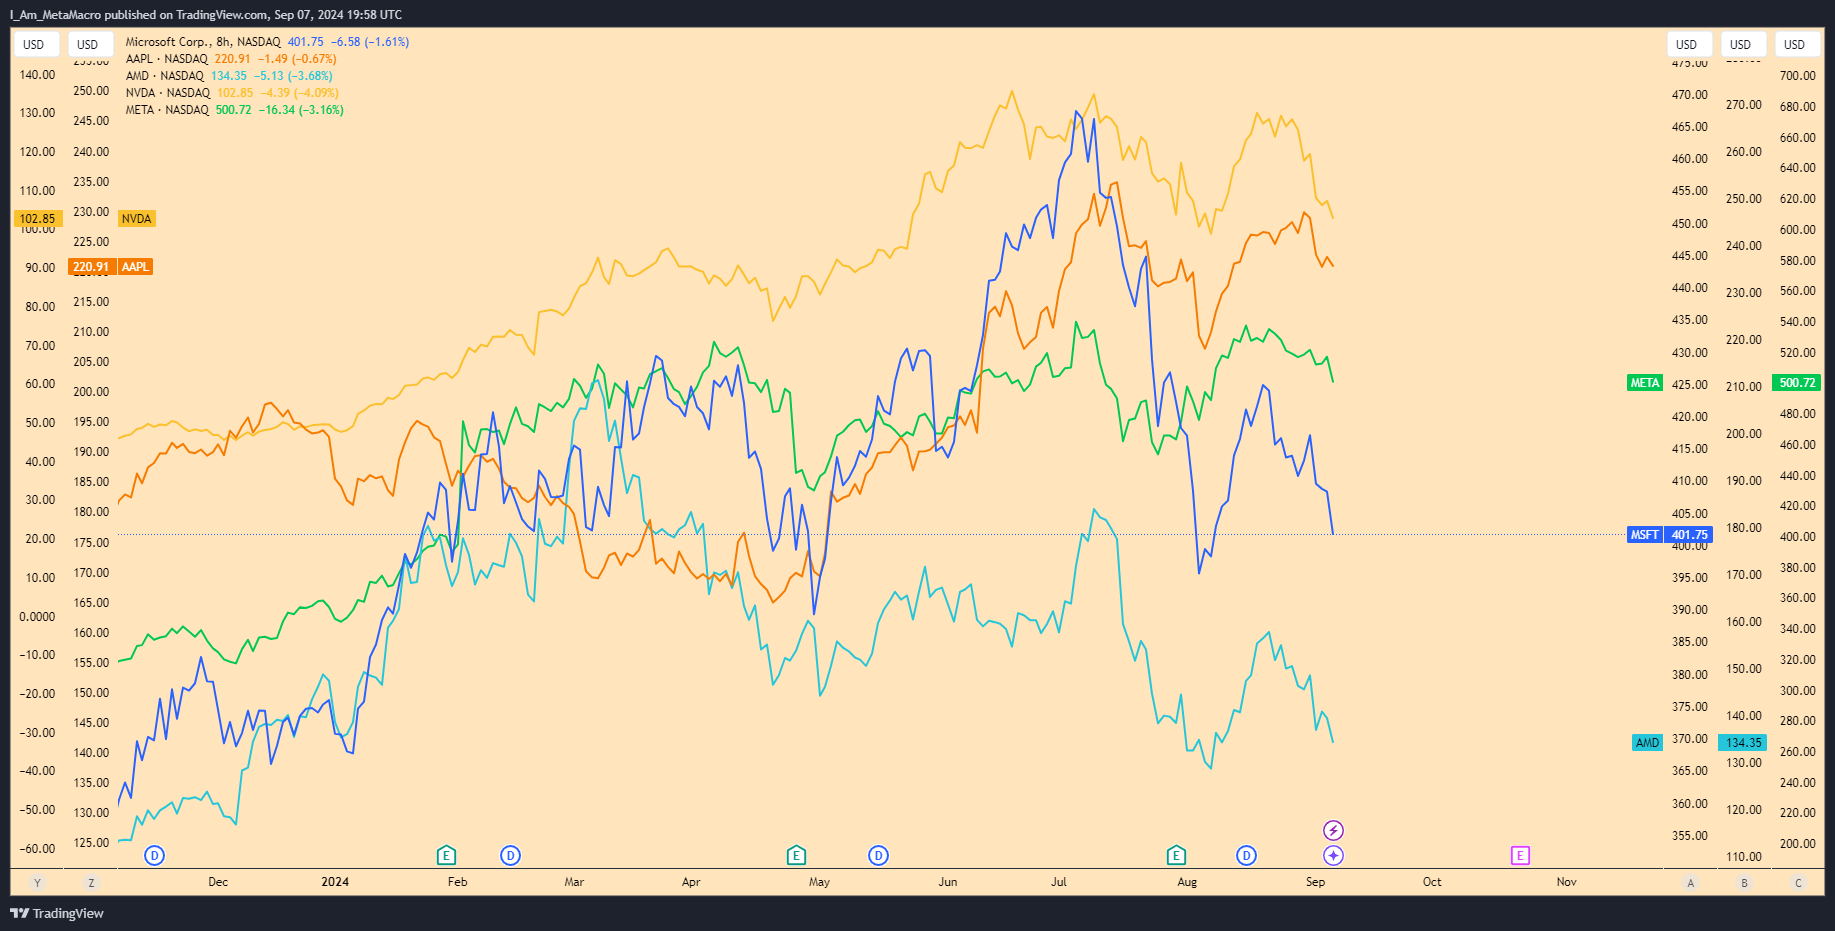
S&P500, NASDAQ and RUSSELL2K
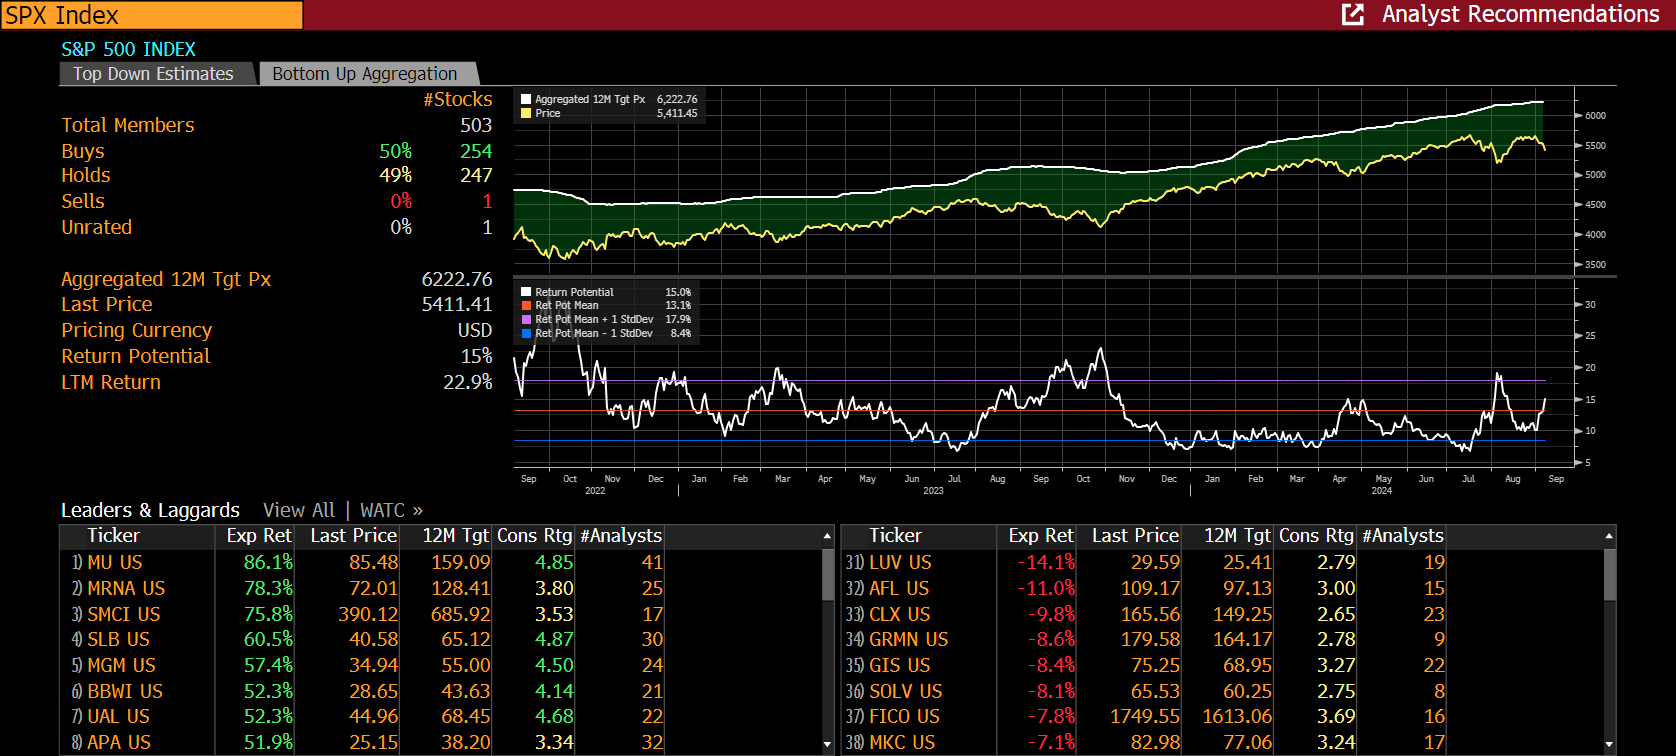
With concerns around softening/weak growth and market participants pricing in a bearish trade into mixed data, the focus is now shifting into the earnings component as a driver of positive flows for equities market, while we see a rebound as market re-adjust on equities that has rallied both from positive earnings and extended valuation, and sectors with such extended valuation are primarily technology and information, hence why the sell-off is more predominant in names like NVDIA, AAPL, AMD and META, amongst others

Additionally, we have also seen a major unwinding of positioning into September,

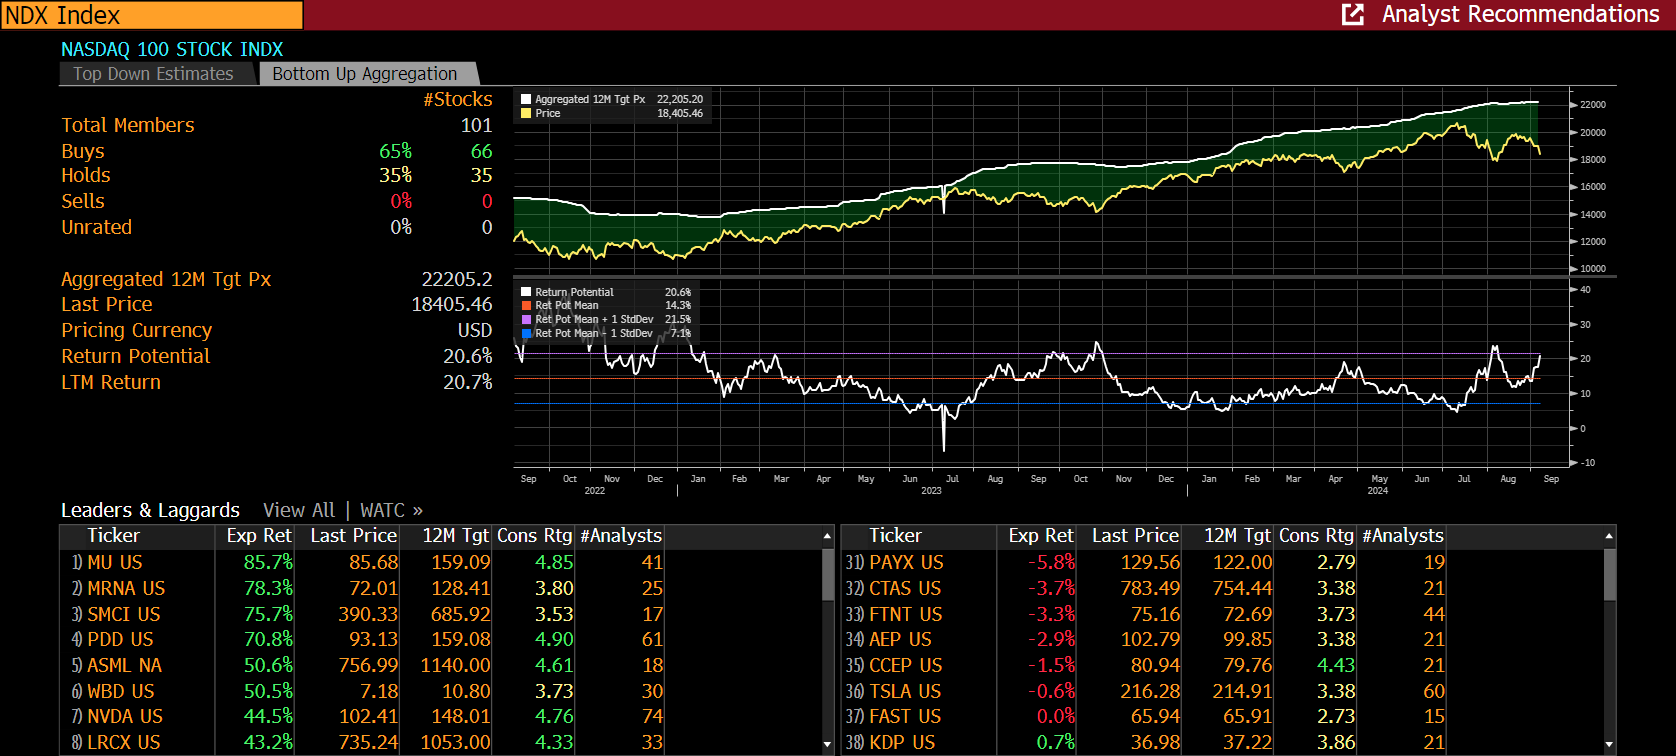
Similar narrative on return drivers also apply to Russell and NASDAQ:
Throughout the period of April to July 2024 in NASDAQ, return driver has primarily been attributed to equities with increasing valuation as highlighted previously, and now we are seeing a shift in that as the market shifts into the earnings justification component of aforementioned names
In previous report, I laid out how NVDIA could price post-earnings release:

Full report here:
Equities Market Color

Yesterday after-hours was quite the frenzy, with NVDIA declining by approx. 7%, the question is what next.
On Russell2k, while the small and mid-cap rotation trade has been a point of focus for fund managers, the drivers of return is largely mixed between Valuation and Earnings components, which requires more work in selecting names to allocate funds too.

If you do review S&P Global Performance report for the month of August for the broad market, the factor profile that yielded positive returns has been Low Volatility and High Dividend stocks, which is primarily a defensive passive approach to investing in a market with a mixed, fluctuating and shifting macro regime across risks in play (Credit and Geopolitical).
Putting it all together what does this mean for me in terms of positioning:
I will be pitching my tent on both end of the spectrum, playing the defensive growth and a bit of the rotation trade on the long side
Shorting high volatility, high valuation stocks that probably needs to reprice to more reasonable and justified levels, then adding a commodity play focus more specifically around the Energy sector that slightly overlaps into the manufacturing sector side, since that’s where the slowdown is coming from.
From a sector perspective, this include:
Long: Utilities, Healthcare and perhaps Real Estate
Short: Energy and Industrials
Neutral/Short: Technology
But I will over-lay factor profiles on them for selecting specific names, but overall you have the broad focus.
The rationale for playing both long and short is to gain exposure to when/if the market reverts back to pricing soft data as good for the market, for the upcoming week, the data is primarily on inflation front, if the numbers are in-line or lower than forecast to validate disinflation expectations and rate cut confirmation, then equities could mean revert slightly.
In conclusion:
I will continue to optimize my information flow and pay attention to what is important right now even if everything is quantifiable.