


SSA Report: Kenya Macro Economic Analysis
Kenya: An Emerging Market in East Africa's Growing Economy

Kenya stands out as a prominent player in the emerging markets of the East Africa region, exhibiting notable growth and development within the Sub-Saharan African (SSA) context. While this report does not delve extensively into the intricacies of the country's economy, it serves as an introductory exploration, positioning itself as a stepping stone onto the shores of Kenya economy.
Exploring other country asset class and having a base level understanding of its economy has been my interest. In addition, I recently opened a stock brokerage account with an investment bank in Kenya - it was the only way for me to be invested enough to figuring out certain workings of its economy.
Without further ado, let’s delve in.
Table of Content
Country Overview
Financial Assets
Equities
Forex
Commodities
Monetary Policy
GDP
Inflation
International Trade
Revenue & Debt
Country Overview

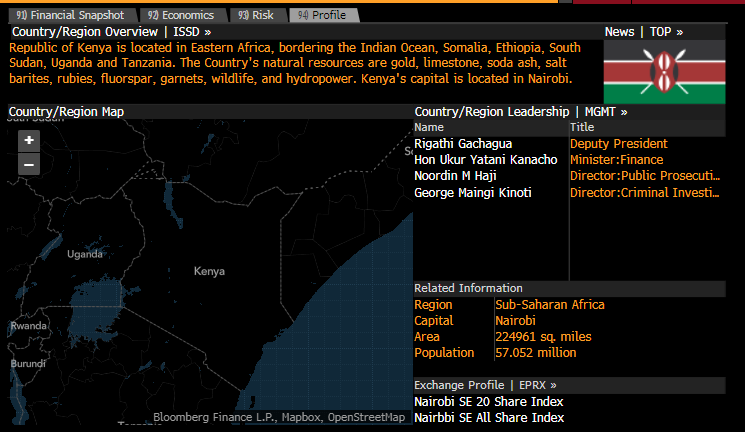
Kenya, situated in the East Africa region, shares borders with neighboring countries including Somalia, Uganda, Ethiopia, and Tanzania. The current Chief of State and Head of Government is President William Ruto. Kenya engages in international trade across the Indian Ocean, with key partners such as China and India.
The nation's economy is characterized by a blend of agriculture and emerging services, where tourism also stands out as a significant export product. Despite its economic activities, Kenya faces a current account deficit in its balance of payments, largely mitigated through external financing, often in the form of debt. Its economic landscape reflects both the diversification of sectors and the challenges in maintaining a stable balance of payments between imports and exports.
Kenya has a trade center called Mombasa, located along the Kenyan and Tanzanian coastlines, where it conducts trading activity through the Indian Ocean with the outside world including China, India, Indonesia, the Middle East, North Africa and Persia.
In terms of natural endowments, Kenya’s resources includes Limestone, Soda Ash, Salt, Gemstone, Fluorspar, Zinc, Diatomite, Gypsum, Wildlife and Hydropower. Kenya has over 48% in Agricultural land, 9.8% in arable land, 0.9% in Permanent crops, permanent pasture of 37.4% and forest of 6.1%. However, with the few resources, Kenya faces two major natural hazards, which are Drought and Flooding (during rainy seasons), most of which impacts its production activities and thus the activity of the economy.

Examining the demographics of Kenya, there has been a dramatic population (currently estimated at 50million) growth since the mid-20th century due to high birth rates and its declining mortality rate – at least you grow old. Almost 40% of Kenyans are under the age of 15 as of 2020, due to the sustained high fertility rate, early marriage and child bearing, and an unmet need for family planning. The rapid population growth strains the labor market, social services and its arable land taking into consideration seasonal natural challenges and the limited natural resources it has.
Kenya economy has a high youth dependency ratio of 65.3% and a elderly dependency ratio of 4.8% which leaves a margin of 29.9% in the workforce. However, it is critical to note that Kenya demographics has a high female to male count ratio. As such there is a huge strain on ensuring meeting daily needs and maintaining a decent standard of living.
Financial Assets

Kenya Equity market comprises of two major indices which are -Nariobi Securities Exchange 20 (NSE20) and Nairobi Securities Exchange All Share Index. The NSE20 Index has a market cap of 1.23 Trillion, compared to Nigeria NGX30 Index market cap of 54.75 trillion Naira. Kenya Nairobi All Share Index has a market cap of 1.29 Trillion KES and a trading volume of 6million daily, compared to Nigeria ASI Index market cap of 55.62 trillion and a trading volume of 486.12 million.
Ostensibly, Kenya equities market depth isn’t deep enough for day-to-day trading, as a result, you would barely experience significant volatility in equities holding, as most of the market activities are within the fixed income space.
Furthermore, on the Foreign Exchange front, majorly with USD, as at the time of this writing the exchange rate is 167KES/USD. Due to the limited natural resources but vast agricultural land, Kenya major commodities are Tea, Coffee, Maize and Sugar.

Monetary Policy
The Central Bank of Kenya (CBK) is currently chaired by Dr. Kamau Thugge as the Governor. The CBK is committed to bringing inflation to the medium-term target of 5% (± 2.5%) towards attaining price stability in Kenya. In 2021, Kenya made adjustment to its monetary policy transmission mechanism, detailed in the paper “Monetary Policy Framework and Operations”. The key thing to note is that the framework is based on inflation targeting and an interest rate corridor around the Central Bank Rate (CBR) set at ± 250 bps, consistent with the new framework, the monetary policy operations are aimed at ensuring the CBK interbank rate, as an operating target closely tracks the CBR – which to some extent is also what the Nigeria CBN team is aiming to achieve.

Visually, you can see how Kenya Interbank Rate closely tracks the Central Bank Rate, indicative of a working transmission mechanism. Compared to Nigeria below, whose Interbank Rate is largely volatile.

I have written a research piece on the importance of understanding Monetary Policy Transmission Mechanism:

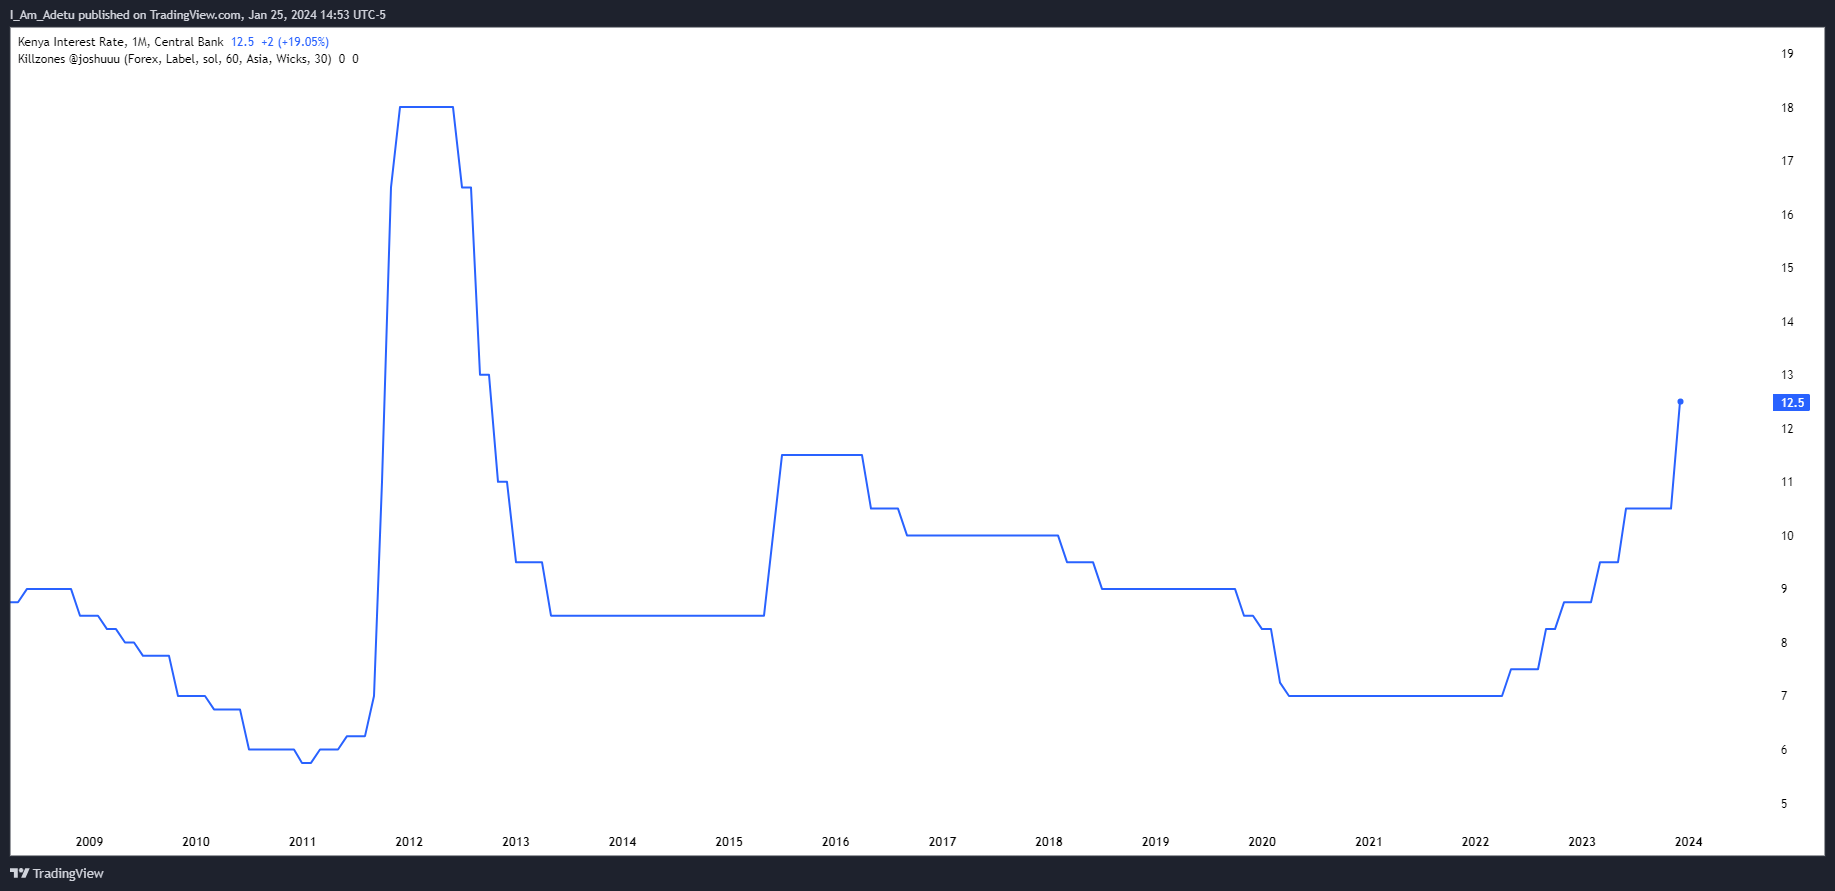
The CBR of Kenya is currently at 12.5% (interest rate) given a series of monetary tightening to manage inflation, but one thing the CBK did was to truly have an handshake with the fiscal policy side towards managing inflation, by allowing duty-free imports on specific food items such as Refined Sugar which it imports from Uganda, Mauritius and Egypt amongst others.

In addition to the bid to control inflation, the Kenyan Shillings (KES) also faced pressure from the appreciation of the Dollar (USD) as a result, the KES depreciated against the Dollar in 2023, but the acceleration in its currency depreciation occurred post covid-19 pandemic.

Overall, inflation has eased following improved supply from harvest and the governments measures to zero-rate duty fee on key food imports. Additionally, fuel inflation and electricity continue to add pressure to inflationary pressures, while non-food and non-fuel inflation stabilized - more on inflation will be covered below
Kenya Gross Domestic Product

Kenya Real GDP stands at 3.5 trillion KES as at Q3’2023, a decline from 3.73 trillion KES in Q2, 2023.

There seems to be a seasonal tendency for the GDP of Kenya to decline every third quarter, which might be attributable to a decline in Agriculture, Forestry & Fishing, which coincides with period of harsh weather conditions (drought & flooding), which impedes production and economic growth.

Kenya economic growth primarily stems from Agriculture, Forestry and Fishing activity. Despite some natural resources, its Mining & Quarrying activities does not contribute significantly to its GDP. The Transportation and Real Estate sector also contribute significantly to its GDP growth. However, it does generate income from Taxes on Corporate, Sales, Personal Income and Witholding Tax.
Industrial Sector - Utilities Production Growth
To add more color on economic growth, from examining Kenya industrial production, there has been an increase in Utilities production compared to levels seen since 2008:

The Utilities sector has picked up production activities from the 100 levels seen in 2016-2021 to the 350 levels, although still largely volatile. Linking the increase in Utilities production to Kenya equity markets, there are only three (3) listed stocks grouped under the utilities sector which are:
Kenya Electricity Generating Co Plc
Kenya Power & Lighting Ltd
Uneme Ltd
Out of the three peers, only Uneme Ltd has seen a significant upside in its stock price from 5.84 KES/Share to 15.10 KES/Share, with the company revenue growing to levels seen in 2017:

Industrial Sector - Information & Communication Production Growth
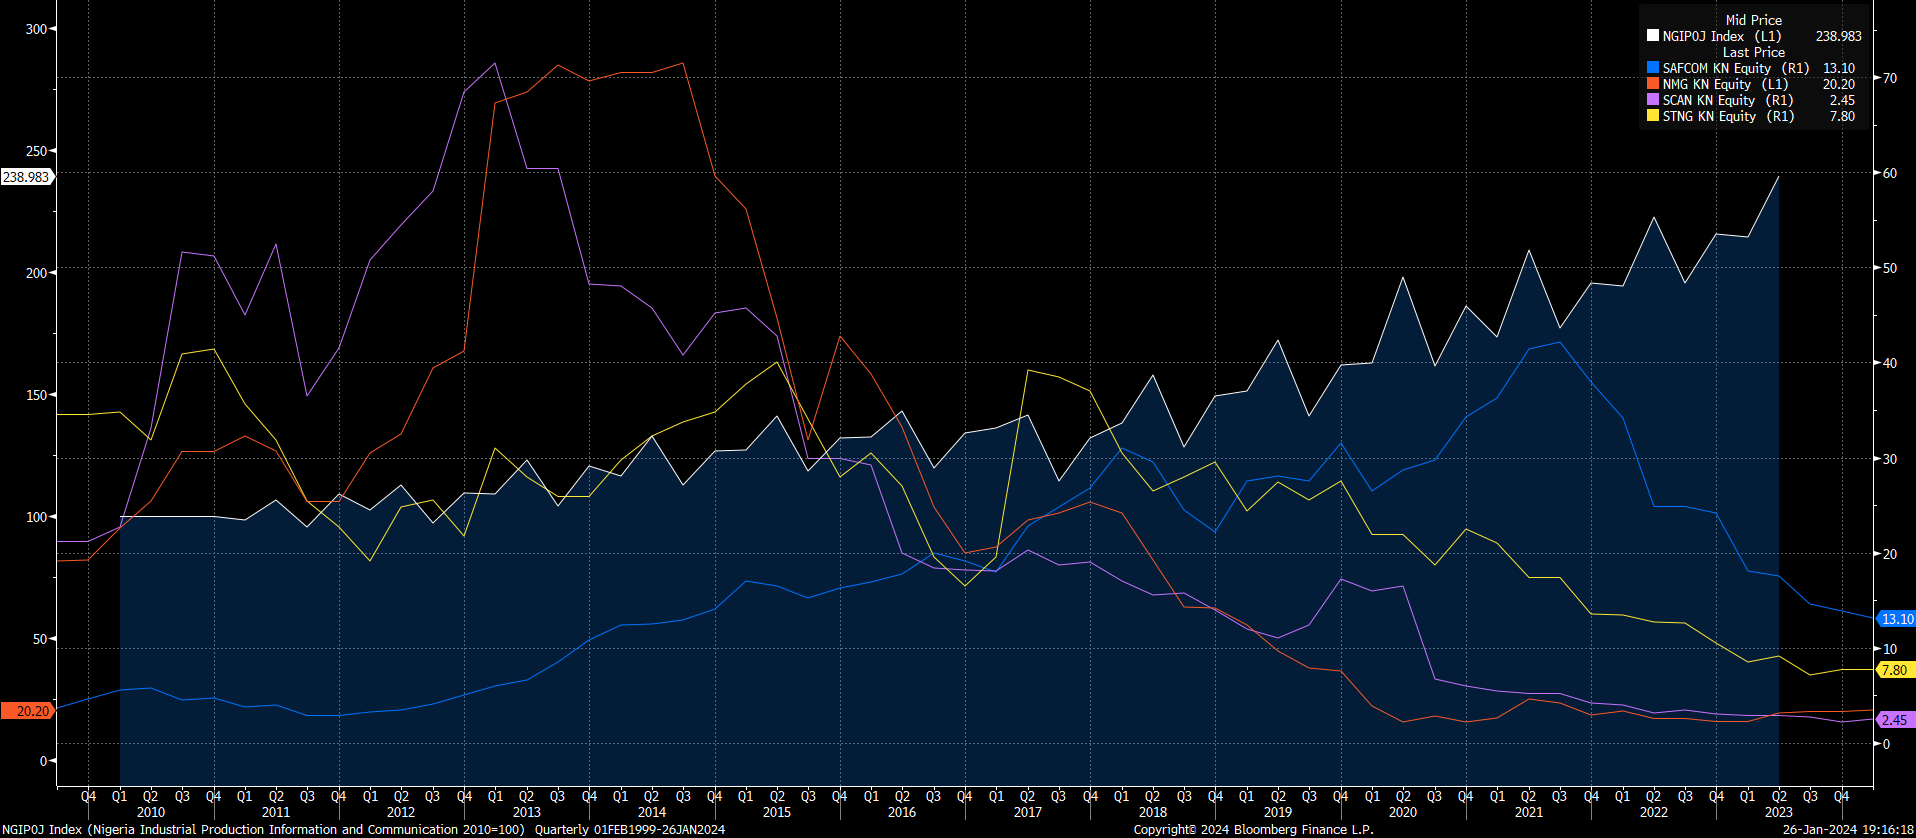
In addition to production growth in the Utilities sector, Kenya ICT sector has also seen massive growth since 2020

However, the growth in ICT sector production doesn’t transmit to appreciation in prices of stocks within the sector, as top members of the Nairobi Securities All Share Index (NSEASI) declined massively especially Safaricom Plc, which accounts for 40.9% of the weight of the NSEASI also had a bearish price action since 2021, despite strong and growing revenue, international investors had exited the Kenya equities market amidst rising cost of living, coupled with relatively safe and there has been a flight to the Fixed Income market.
Other sectors experiencing growth are the Solid Minerals and Manufacturing sector.
Kenya Inflation
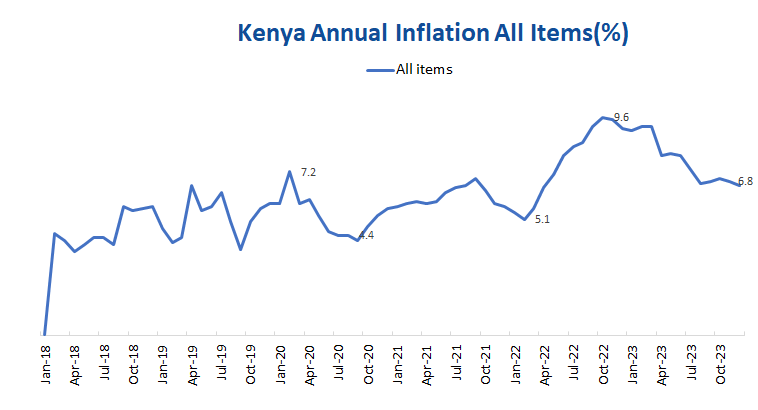
Kenya inflation on All Items peaked at 9.6% in October 2022 and declined as Monetary Policy tightening coupled with fiscal policy hand-shake effectively limit the impact of import driven inflation by implementing zero duty fee on imports, as a result, inflation eased to 6.8% as at December 2023.
In March 2020, as COVID-19 became a pandemic, Kenya inflation rose from 4.4% to 6.4%, which eventually bottomed at 5.1% as the CBK started hiking rates from the 7% level to 8.25% in October 2022. However, as the Russia-Ukraine war caused disruption in Global Chains and increase in prices of commodities, Kenya inflation rate rose again from 5.1% to 9.6% despite continuous tightening in rates by the CBK.
In May 2023, the CBR rate was already as high as 9.5% as inflationary pressures declined into the end of 2023, while rates remain elevated at 12.5%. The CBK remain committed to bringing inflation down to the 5% medium-target level and a decline from 9.6% to 6.8% in a year is a commendable effort, and definitely not the time to take the gas off the pedal, evident by an additional rate hike in December from 10.5% to 12.5%.

Stripping down the major contributor to inflation - Transport, Housing & Utilities coupled with Food and Alcoholic Beverages were the major contributor to rising inflation Kenya, and evidently slowing down, but the Housing/Water/Electricity/Gas & Fuel poses risks to bringing inflation down to the CBK target, taking into consideration rising Geo-political conflict in the middle east and rising Oil Price.


Just to re-iterate and commend the effort of the CBK, evidently inflation in Kenya in the major contributor components have slowed down since Sep’2023, although still volatile, there’s work to be done.
Kenya International Trade
Kenya international trade flows in terms of exports is majorly accounted for by the United States, Uganda, Tanzania and Netherlands
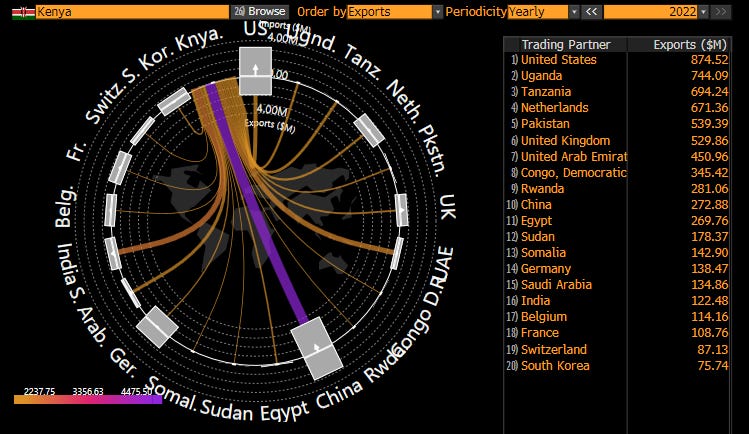
On the other hand, Kenya imports majorly from China, India, United Arab Emirates and Saudi Arabia.

Kenya majorly earns its surplus from neighboring countries, and its deficit are accounted for from its top import sources (trading partners).
Kenya Exports Trading Activity

Kenya major export are Tea & Horticulture products, with destination to neighboring countries such as Uganada, Tanzania and Rwanda.

Based on more recent data (as at Dec’2023), there isn’t a significant divergence from OEC World data as at 2021. Tea still remains the second largest component of value in terms of exports for Kenya majorly to Pakistan, UAE and Yemen. While the other component which includes Horticulture products are exported to Netherlands, United Kingdom and Germany.

Kenya export activity are the source of its FX earnings and with resources that are not largely in demand in the Global market, it impacts its ability to withstand depreciation in its currency against the Dollar.
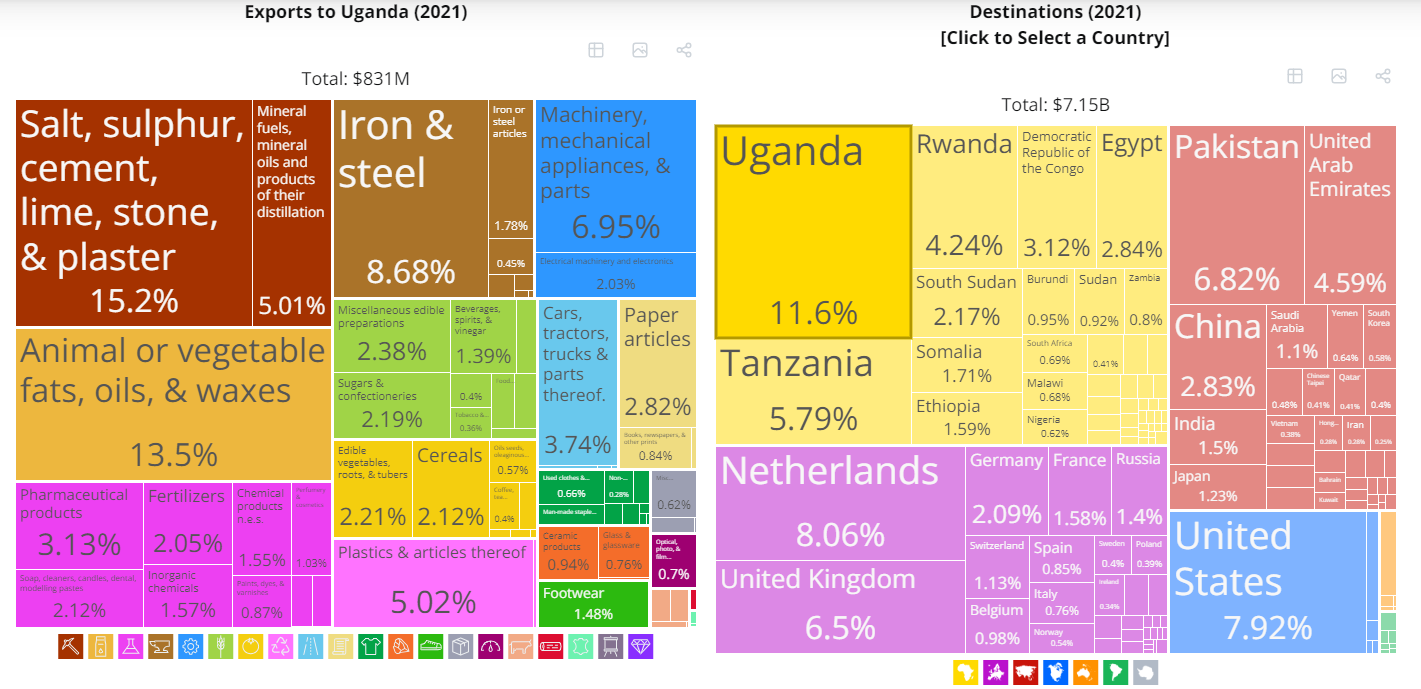

Examining its trading activities to its neighboring countries, majorly Uganda, Kenya exports Salt, Iron & Steel, Machinery and others to Uganda. It also exports Soap and some Pharmaceutical products to Tanzania, of which both trading countries account for over 60% of trading revenue for Kenya.
Kenya Imports Trading Activity
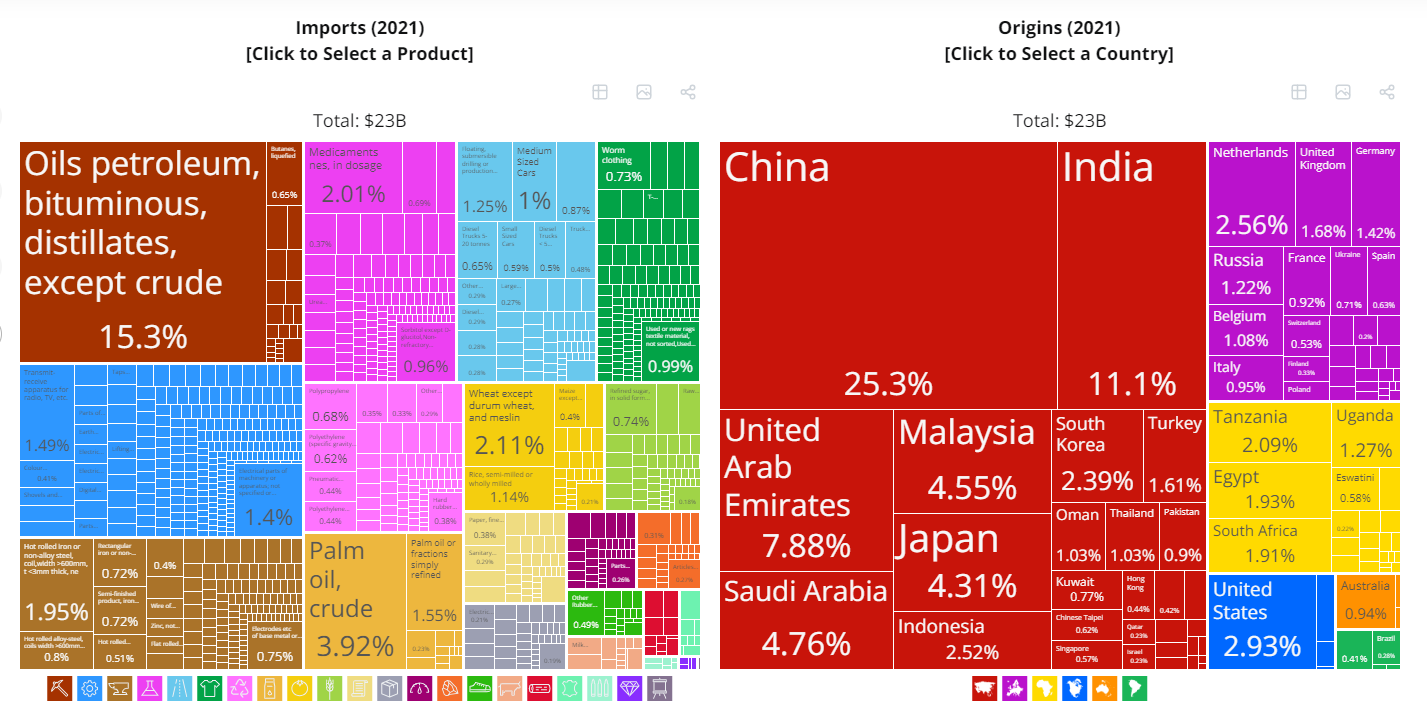
Kenya major imports also include Oil, Wheat, Palm Oil, Medicaments, Refined Sugar, Rice, Maize, largely imported from China, India, UAE, Saudi Arabia and other countries.

As globalization and increasing inter-connectedness, Kenya has become a major importer for China products, importing majorly Machinery products and other home appliances. While she majorly imports Oil and Pharmaceutical products from India.
On the domestic front, Kenya import from South Africa had narrowed since 1998 till-date, as it majorly imports Cars, Iron Steel and Machinery equipment’s from South Africa. However, Kenya seem to have broadened its demand to Egypt, where she majorly import Paper Articles, Plastics and Sugar products from. Additionally, Tanzania is also a major trading partner where Cereals, Wood, Paper Articles, Live Animals, Used Clothes and Ceramic are majorly imported from.

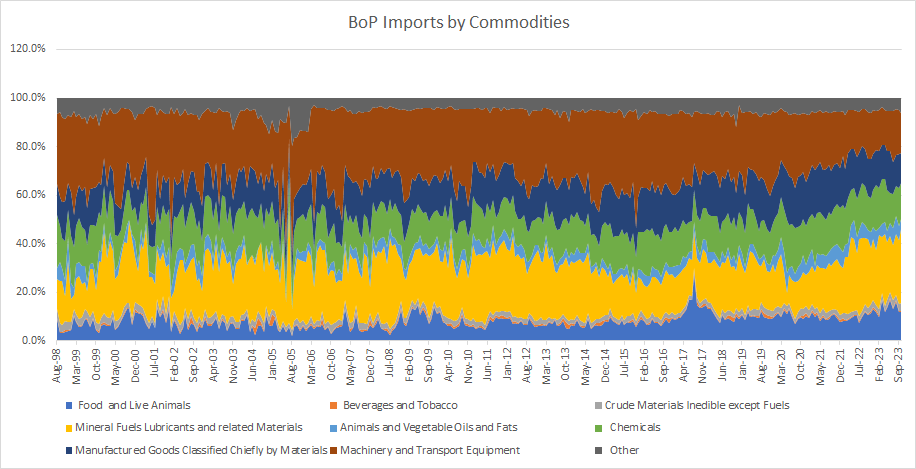
Finally, since 2020, there has been an increase in demand for Fuels, Lubricants & Related Materials, which has been a major contributor to inflationary pressures domestically in Kenya.
Government Revenue and Debt
Kenya public debt level has been historically high on the external front at a level of 67% to total debt, but she has been able to reduce its reliance on external debt to 55-48% of its total debt

Most of Kenya domestic debt are largely financed from issue of Treasury Bonds and Treasury Bills, with rates on T-Bills as high at 16.52% on the long-end (365D), 16.375% on the mid-end (180D) and 16.2903% on the short-end (90D)

With Fixed Income rates at premium levels of 16%+, why should anyone risk their money in equities?
A brief review on the Government Revenue and Expenditure, Import duty contributed a max of 3% in revenue(inclv. of grant) since 2019, consistent with the fiscal policy stance to curb rising inflation. However, the largest revenue source of the Government is from Income Tax and VAT, of which tax pressure impacts consumer spending , further transmitting to available disposable income to maintain a certain level of standard of living.

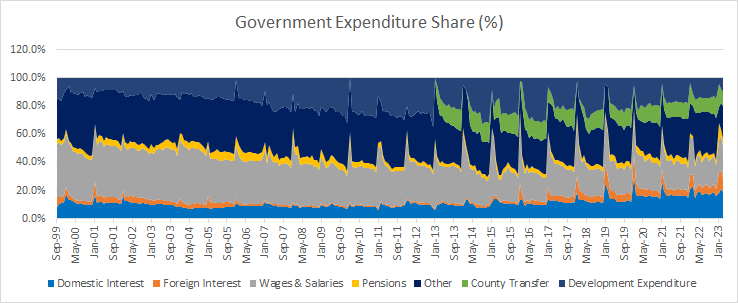
On the expenditure side, Kenya expenditure based on data seems relatively balanced with expenditure on servicing domestic and foreign interest and infrastructure spending, with little expenditure on pensions given its population demographics:
In conclusion, the Kenyan economy presents an intriguing landscape. While trading equities may not be the optimal choice, opportunities emerge in the fixed income market, with attention warranted towards currency depreciation. However, the economic scenario is not without its inherent risks. Geopolitical tensions, volatility in the oil market, a heavy reliance on imports and low industrial production for crude materials pose tangible threats.
The Central Bank of Kenya (CBK) appears to be effectively managing inflation, despite existing pressures. Yet, increased taxes and monetary tightening raise concerns about reductions in consumption expenditure. The overarching impact is evident in the broader context of the cost of living, influenced by a contractionary fiscal policy. The government, seemingly constrained by limited resources and seasonal weather challenges affecting production and growth, appears compelled to rely on squeezing taxes to generate revenue, managing its external debt and implementing monetary tightening for economic development and stabilization.
It is crucial to emphasize that this serves as an introductory primer to the Kenyan economy. While aspects such as the position of the banking sector, credit creation, and other data points have not been included in this report, the provided insights lay a robust foundation for further exploration. If these aspects pique your interest, there are more data points to explore and connect across asset class, offering a more comprehensive understanding of the dynamics at play.
If you find this report valuable do not hesitate to share, and if you have any questions, or would require me to cover certain topics, you can reach out to me on the following platforms:
LinkedIn: https://www.linkedin.com/in/ridwan-adetu
Twitter: @I_Am_MetaMacro
Also, thank you for 200 subscribers since I started this platform 4 months ago, thank you for your attention, and further updates on the Kenyan and other SSA economy will be shared in subsequent reports within the SSA Report series.