


Research: Non-Linear Dynamics, A Primer to Quantitative Signals in Trading
On Closer Examination, The Picture is Not That Bleak.

For one thing, knowing the truth, even if it makes life complicated, is better than hiding behind a convenient, but untrue story.
Hey Readers, I have received valuable comments and appreciation for my work. Thank you very much for your compliment and feedback. As we unwind the year 2023, I most likely won’t be writing any macro report until next year, primarily due to the fact that there are no major macro events to update on, both domestically and globally.
However, if any event pops up I will cover them. My focus right now, is to dish out the research I have written in my journals as they set up the new features that I will be adding to MetaMacro, to give value to you and as part of recognizing the iterative feedback.
The Goal remains the same: To Provide Actionable Insights for Investment Positioning Ideas
In this report, I will be setting the foundation for how I interpret the market, more like a dialogue of how I approach trading the markets, and this will be useful as I intend to launch a Quantitative Signals section where I share actual trading ideas based off the other information I share.
This article might be a bit technical and lengthy, but I will try my best to simplify, so without further ado, let’s get started.
Introduction

Trading the financial market usually involves considering multiple sources of data to make an informed decision of where price is most likely to move towards. That’s all we do as investors, its about the Where, from the Now.
The market is a complex system that involves multiple variables, as such, before we embark in investing in such a complex system, it is critical to understand the key variables that makes up the system, and these variables can be segmented into Macro and Micro Variables.
The Macro variables I tend to assume as what lives outside the charts itself, such as Fiscal Policy, Monetary Policy and Geopolitics. While the Micro variables are what makes up the charts itself, such as Time, Liquidity and Efficient Price Delivery.
I have been providing content on the Macro variables, now the Micro variables are coming to play.
Micro Variables Influence on Price Delivery
The above price data, if I had to ask what timeframe it was plotted on? It could be the Daily Chart, 1 hour, 15 minute or 1 minute chart. Regardless of timeframe the data almost looks similar across board.
The key note here is that Time is used to organized the delivery of price as calendars and clocks are used to organize our daily activity in the real world.
The Concept of Equilibrium and Value
The market or price abhors equilibrium, it moves away from it. When a system is at equilibrium, it simply means the system is dead, therefore, price has to move from one price level to another in order to seek value.
The process of price seeking value involves two acts:
The Act of Seeking Liquidity on the Buy or Sell Side
The Act of Rebalancing Inefficiency on the Buy or Sell Side
Liquidity exists above old highs and lows
Inefficiency on either side occurs when price is only offered and delivered to one side of the market (either the buy or sell side).

As stated earlier, the market abhors equilibrium, thus a healthy market is one with volatility that constantly moves away or to the fair price determined at specific time-windows.
How then does the market know the fair price at every interval? This is a complex question with no straight forward answer, but the closest way to view it is from the lens of the market participants. For stocks, fundamentalist have this idea of what the fair price of a stock is based on their valuation models, for currencies market participants that buy and sell daily have their own view of what the fair value is - quite a number of views on what fair value could be.
I will draw back on this section towards determining fair value based on price data in “Fractal Dimension, Price Delivery and The Hard Right Edge” section below - stay with me on this ride.
Investors and Returns
There are two types of investors or traders -the Noise Traders who follow fashion & fads, and Smart Money Traders who invest according to value. As a trader, at every given interval, the key question to ask yourself is from the perspective of a seller what is the fair value to sell at, and from that of a buyer, what is the fair value to buy at.
Within a price range, Identifying what the fair value to sell at and the fair value to buy at gives a range for price to oscillate in.
In addition to knowing the fair value, investors often worry about the returns/profit from any given trade or investment. A smart investor would utilize weighted probabilities to determine expected return, I recently find this useful but with a flaw of subjective bias, and I will give an illustration.
Illustration on Weighted Probabilities Returns

As an investor/trader(“will be used interchangeably going forward”), we assume I executed a long trade at 81.0 and I have a conviction that price will trend higher, as such I develop 4 target levels with various levels of conviction:
82.77(+2.18% from entry price) - 50% probability that price will offer this return
83.50(+3.07% from entry price) - 20% probability that price will offer this return
84.0(+3.68% from entry price) - 10% probability that price will offer this return
84.55(+4.34% from entry price) - 10% probability that price will offer this return
Based on the 4 target levels and weighted probabilities I can derive a new target level as follows:
Target Return = P(1) x 50% + P(2) x 20% + P(3) x 10% + P(4) x 10%
Target Return =2.18% x 50% + 3.07% x 20% + 3.68% x 10% + 4.34% x 10%
Target Return = 2.506%

Now, like I said earlier, the percentage of probabilities to assign is completely dependent on the trader and so is the number of target levels, personally I would restrict the target levels to between 3 to 4 and leave it to you to determine a fixed probability weighting for each target point.
Moreover, the additional twist to the equation is that you could add a probability for a negative return to account for loss. But, that’s entirely up to you.
Liquidity, The Force of Price Delivery
Motion is achieved by perturbing the system with an extreme force. The force in the case of price delivery is the drive or push to seek liquidity. To draw on the concept of price fractals, as the higher timeframe seeks liquidity, it will cause the lower timeframe to move away from equilibrium to seek new equilibrium.
Identifying the draw on liquidity from the higher timeframe is key to understanding how the lower timeframe will seek new equilibrium
Fractals give structure to complexity and beauty to chaos
The concept of the relationship between higher timeframes and lower timeframes can seem paradoxical as a higher timeframe can be a lower timeframe to another higher timeframe and a lower timeframe can be a higher timeframe to another lower timeframe. E.g The Daily timeframe is a higher timeframe to the 1hour timeframe, but at the same time the Daily timeframe is a lower timeframe to a weekly timeframe, therefore the concept of the motion perturbing the system with an extreme force could be found from the weekly or daily timeframe. I could draw on this further, but I aim not to confuse you…. lol
The key thing to note is that:
A natural object shows more detail the closer one looks at it, all the way down to the sub-atomic level. The closer they are examined the more detail can be seen.
As such to see the details of the Daily timeframe, a lower timeframe has to be used.
Fractals and Multi-Timeframe Analysis
A fractal Is an object in which the parts are in some way related to the whole. It has an element of self-similarity such that if you view a Daily, 4 hour or 1 minute Chart without referencing them, they all look similar, and the simplest way to generate fractals is to take the same rule and iterate it over and over again, and as we iterate the process, we then find that we have infinite complexity generated in a finite space.
Below are multi-timeframe charts of the Brent Crude Oil, which is the HTF or the LTF chart? hard to tell cause they all look similar don’t they?

Fractals and Price Delivery
The price system made up of fractals is mostly regarded as a random system and unpredictable, that’s an argument for the lads. Thing is, a system has no idea where it is going until the dice is rolled - this statement is synonymous to price delivery such that before price moves, it accumulates.
Furthermore, forecasting the direction of the system is close to impossible, yet once the system receives information, it is processed according to internal deterministic rules with limited range of possibilities which in the case of price delivery are:
Drive to Liquidity
Drive to Fair Value
Drive to Rebalance inefficiency
Equilibrium
Price only does one of the four things above at a time, 4 possibilities that are finite. But to predict or anticipate what possibilities is likely to occur, then current data plot has to be a function of the prior data plots.
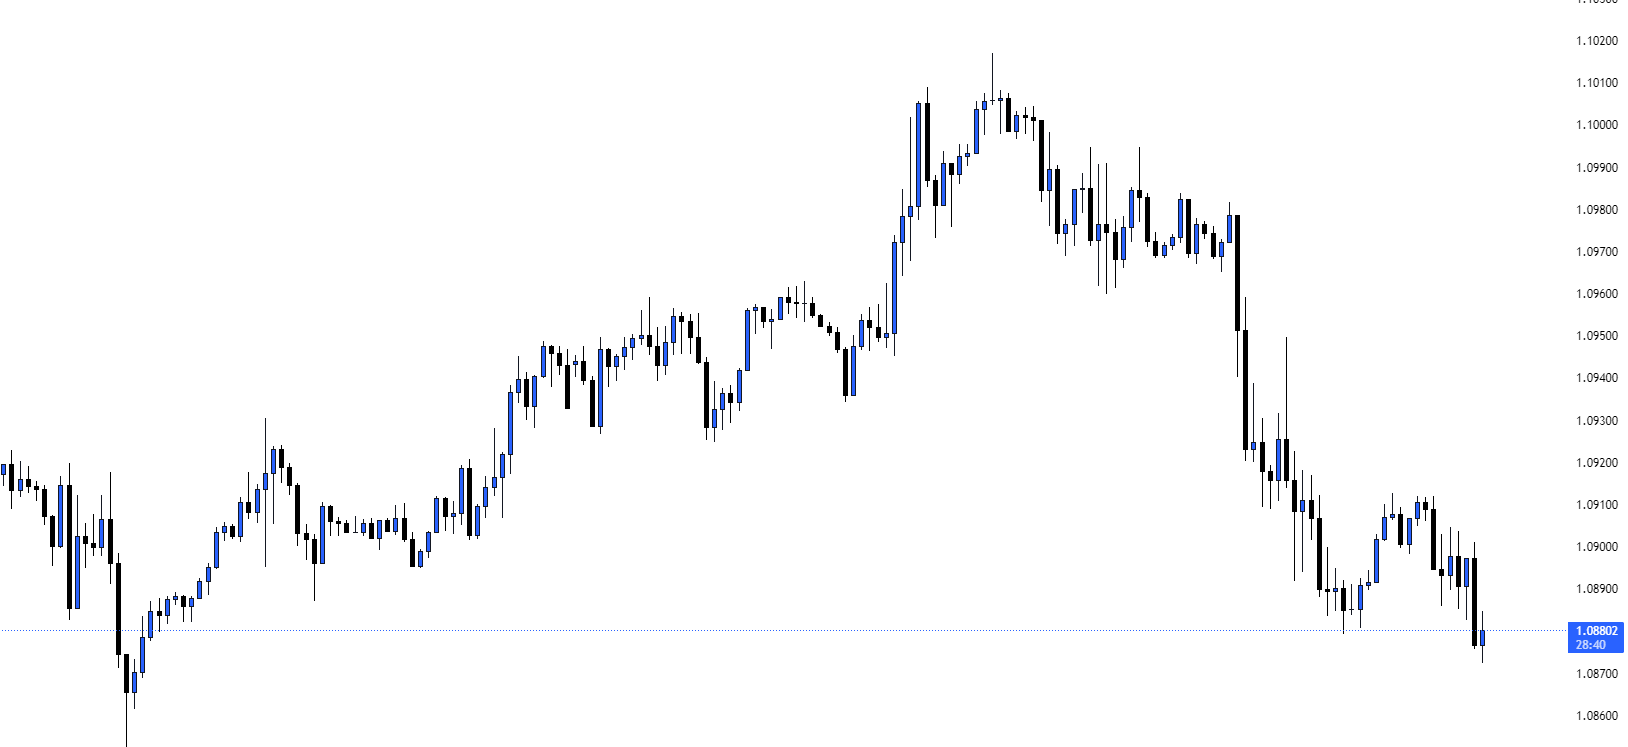
Fractal Dimension, Price Delivery and The Hard Right Edge
The job of a trader isn’t only about considering what has happened in the past but more anticipating or predicting what will happen to the right side of the chart. This right side is a “Space”
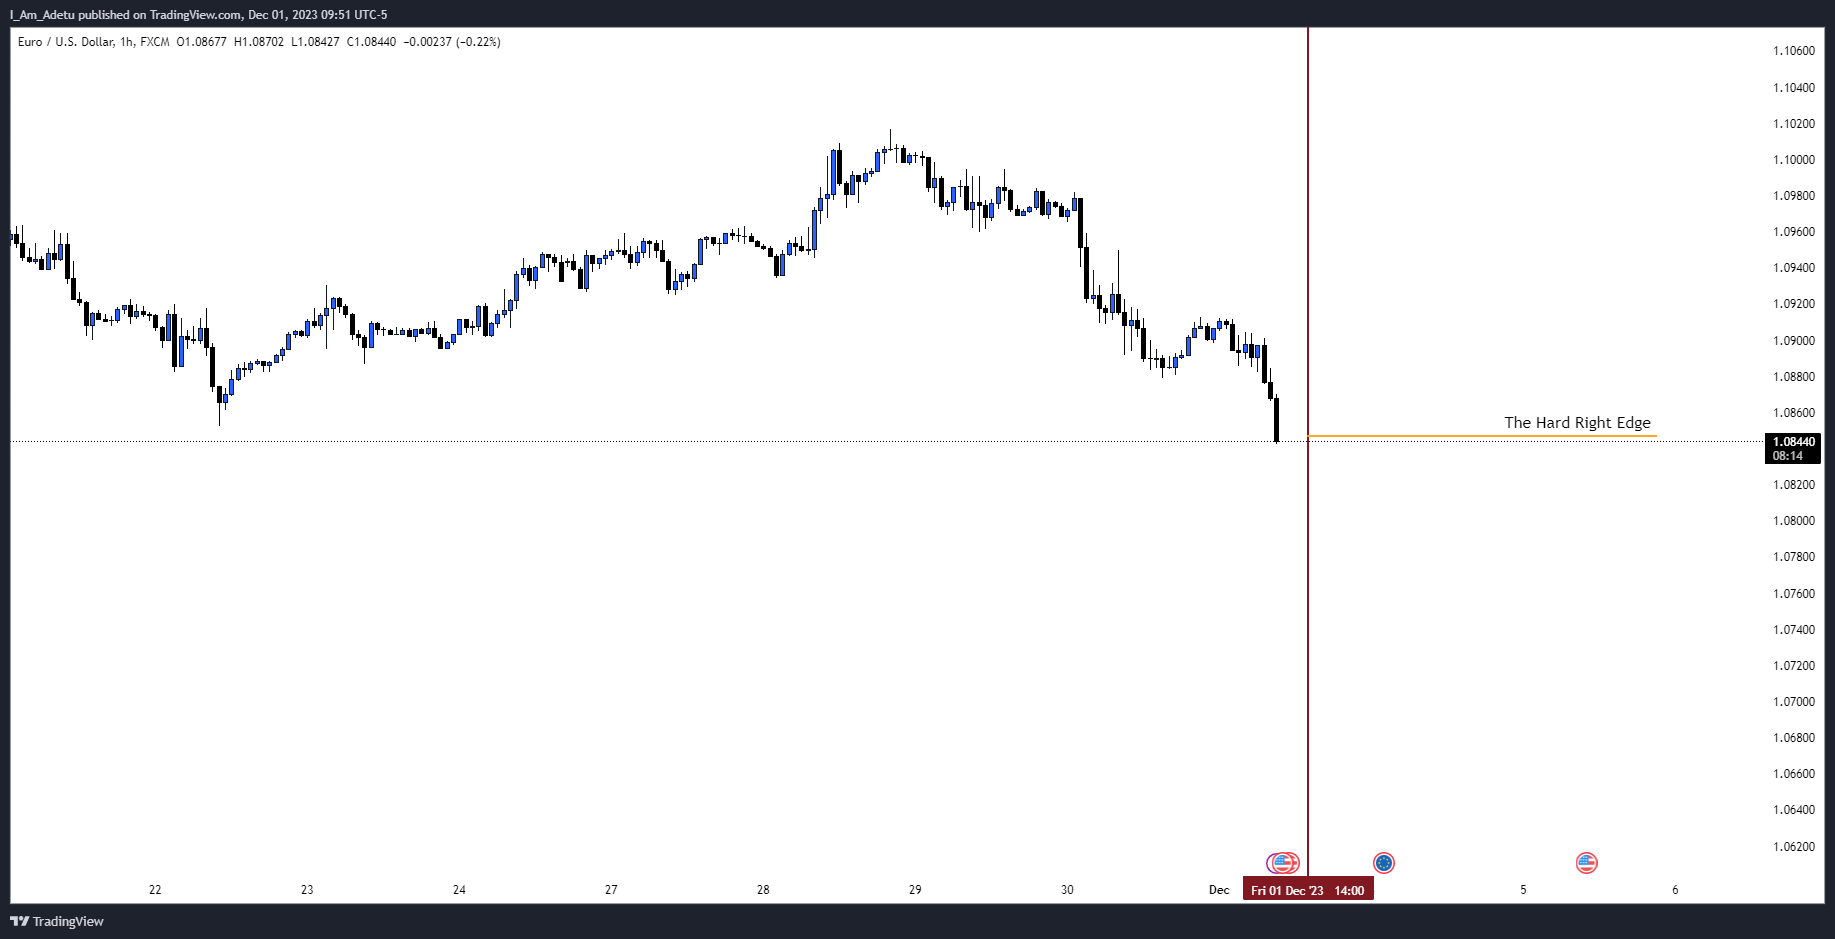
The concept of Fractal Dimension describes how an object fills its space and how it is a product of all the factors/variables influencing the system that produces the series. It is also crucial to note that sometimes, price will remain in a tight range just to fill space, a term called White Noise - Bitcoin is the king of that.
To determine the fractal dimension, we must measure how the object or time series fills its space. To get a grasp on this statement, let’s examine this analogy: When we measure a coastline with a six-foot increment ruler, we get some detail but when we measure with a three-foot ruler, we get more and more detail — like a magnifying glass, such that the lesser the measurement, the more detailed and longer the length, as such the length of the coastline is dependent on the size of the ruler. With respect to Price delivery:
The Length of Price = f(Timeframe)
However, the lesser the measurement, the lesser the predictive power
The key takeaway is that the fractal dimension shows us how the shape or time-series fills its space. The way an object fills its space is determined by the forces involved in its formation. In the case of a coastline, the relevant forces are the geological phenomenon involved in its formation such as water pressure & volcanic activity. However, for price delivery the relevant forces are the micro and macro data that influences the perception of value.
Now, to not beat around the bush, how do we identify the appropriate ruler scale when it comes to price analysis within a timeframe. The scale to use is a Non-Overlapping price interval of the timeframe. This non-overlapping interval then creates a cycle. However, there are subjective choices to what number of cycle to use it could be 5, 10, 7, 8 and more, the key is to find the cycle that has the best fit, I settle for 10 non-overlapping cycles, anything more than that is a stretch. For a 24hour interval/Daily timeframe, the 10 non overlapping cycle is as follows(in UTC time):
12:00 am - 2:00 am
2:00 am - 4:00 am
4:00 am - 6:00 am
6:00 am - 8:00 am
8:00 am - 10:00 am
10:00 am - 12:00 pm
12:00 pm - 2:00 pm
2:00 pm - 4:00 pm
4:00 pm - 6:00 pm
6:00 pm - 8:00 pm
I prefer to transpose this intervals into the 15min lower timeframe, and I group each 2 cycles as one:

Recall, this section above “The Concept of Equilibrium and Value”, I use the cycles to determine fair value for buyers and seller as price fills the space to the hard right edge. The use of cycles is only one component of fair value. The other component of identifying fair value hinges on understanding past data.
The Ripples of Price
It is also critical to note that what happens today influences the future. Where we are now is a result of where we have been in the past. Today’s events ripple forward in time and the size of the ripple diminishes until for all intents and purposes, the ripple vanishes. This effect poise us with the task of looking back into the past data and casting forward in time the effect of past ripples in price formation as price fills the space on the hard right hedge.
Michael J. Huddleston introduced a concept of Look Back and Cast forward called Interbank Price Delivery Algorithm Data Ranges. He anchors the event to the start of the month or quarter, and looks back 20, 40 and 60 days while also casting forward 20, 40 and 60 days. This concept can also be applied on the lower timeframe ranges in respect of the ripples in price.
Price a Dynamic System, A Phase Space and Its Lyapunov Exponent
Hey! are you still focused or have I lost you? This is the final note.
Price is a dynamic system such that it has a sensitive dependence on initial conditions as they are largely feedback systems. What comes out goes back in and this loops exists continuously. As such, the concept of “Critical Level” becomes valuable.
We are quite familiar with the phrase “The straw that breaks the camel’s back”. The straw isn’t the last straw, but the cumulative weight of the straw that surpassed the Camel’s ability to stand (the Camel’s Critical Level). Therefor:
the system of price delivery is a non-linear feedback system, with sensitive dependence on initial conditions, critical levels and fractal dimensions.
In addition to the above, the visual inspection of the data becomes important in non-linear dynamic systems, because the problem of identifying where price ultimately wants to go, and have to go first, to get to where it needs/wants to go has no single solution.
In price, there are usually multiple and perhaps infinite solution. But the key note is that the system is usually attracted to a region of space and the set of possible solutions often has a fractal dimension. For clarity, the phased space comprises of two basic classes:
The Point Attractor: This is the simplest type of solution, a point of origin that offers equilibrium state of the system or the opportunity for fair value.
The Limit Cycle: This is when the solution resides between two possible point of origin, like a price range.
The ability to identify the point attractor and the limit cycle is reliant on the investor knowing that:
Where we are is dependent on where we have been, and how accurately we forecast the future depends on how much we understand about where are, as one event in the past or present can influence the future indefinitely, even though the system may remember the event for only a finite length of time.
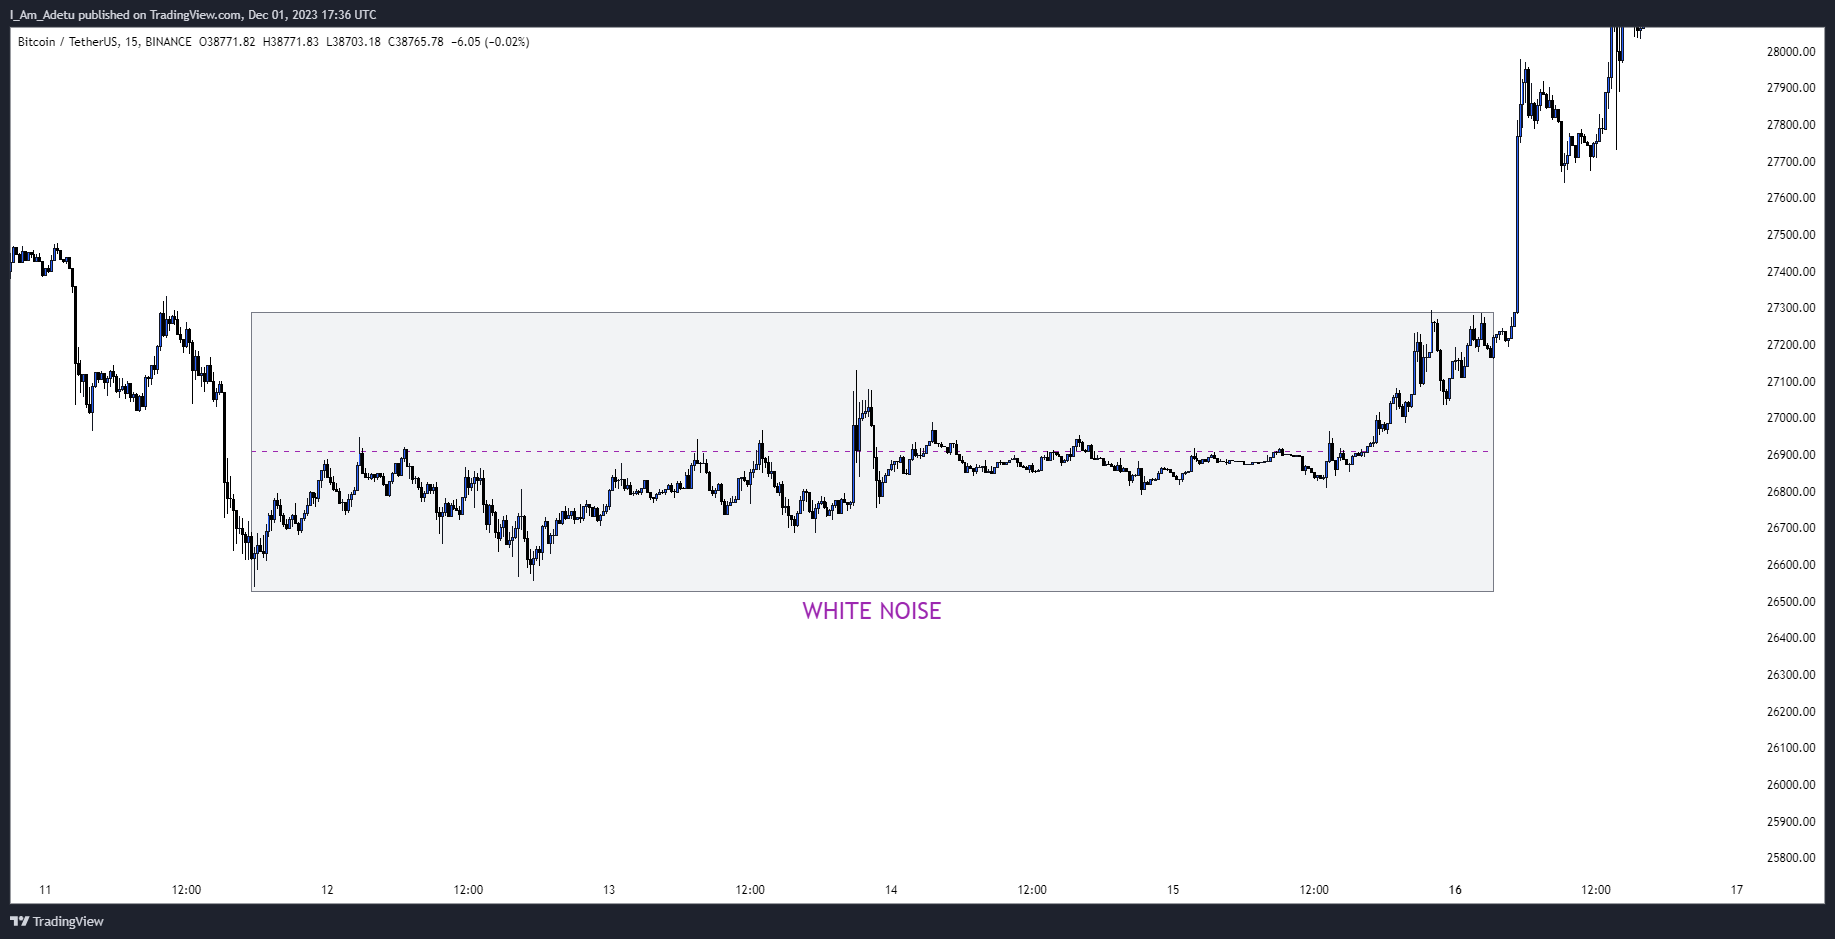
One more thing to touch on is the volatility of price when it comes to high-impact news event or black swan. The Lyapunov Exponent states that the exponent of a dynamical system is a quantity that characterizes the rate of separation of infinitesimally close trajectories - Wikipedia

Usually, we see price rally or decline with super-speed beyond a normal average trading day from a specific price level. What happens here is that price swings wildly away from its limit cycle before it settles into a new limit cycle.
Case in point: I covered this event in this Macro Report

Except you have a strong edge, it is best to stay away when the market is most likely to swing wildly away from its limit cycle.
While the system has been perturbed, the key question to ask is how long it will take for a system to re-establish itself after it has been perturbed. For example, once the pendulum loses its rhythm, it will settle back to a steady rhythm with new amplitude within a limit cycle.
Everyday as a trader, your job is to actively construct or re-construct a phase space, and to do so, we need to know all of the variables relevant to the system, most of which I have highlighted. In summary:
Choose an orbital period
A fixed interval of time (the evolutionary period, a non-overlapping cycle)
A Constructed Phase Space and its Classes
The relation of each data to the data before it.
Sample Quantitative Signal: Brent Crude Oil

The above is a sample quantitative signals:
Orbital Period is the Daily chart direction
A point attractor characterized by Buy Side Liquidity - which relates to historical data
A constructed phase space, where I expect price to find equilibrium between the point attractor and limit high
Sample Quantitative Signal: UBA Nigeria Plc Stock

Examine the construct above and the construct in play and ask yourself, where is price likely to drive towards….. homework for you :)
While there is more to what I have displayed, this sets the stage for the launch of the Quantitative Signals section of MetaMacro, come 2024.
Awesome write-up bro. Lots of valueable lessons learnt. Should also be called ICT primer 😂😂.