


Macro Dynamics of the Global Corn Market: Drivers, Flows, and Mechanics
A Comprehensive Report on Trading the Corn Market


Previously, we had written a report on trading the Global Commodity Market with some generic framework. In this report, the focus is purely on the Corn market and it provides more flesh into plugging and playing with the existing framework made available in the previous report here:
Global Commodity Market: Comprehensive Model

I have shared a comprehensive model on the Global Currency and Equities market, now the Commodity market is next in line. Other asset class that are of import to me will also follow.
Brief Foundational Narrative
The global corn market is a complex and dynamic landscape, driven by an intricate interplay of fundamental supply and demand, macroeconomic forces, and geopolitical shifts.
As a cornerstone of global food security, animal feed, and increasingly biofuel production, corn's price movements have far-reaching implications across various industries and economies. While recent forecasts point to record global production for 2025, leading to a general softening of prices, robust international demand, particularly from China and the Middle East, are absorbing new supply, preventing a significant build-up of reserves. This creates a market operating with thinner buffers, making it acutely sensitive to unexpected supply shocks, especially those induced by climate change.
Geopolitical tensions, even in regions not directly involved in corn trade, exert significant indirect pressure through input costs and logistical disruptions, fundamentally altering trade norms towards strategic stockpiling and diversification. Navigating this environment requires a sophisticated understanding of market variables, participant behavior, and the application of advanced quantitative strategies, alongside robust risk management and leverage control.
Introduction to Corn's Global Significance
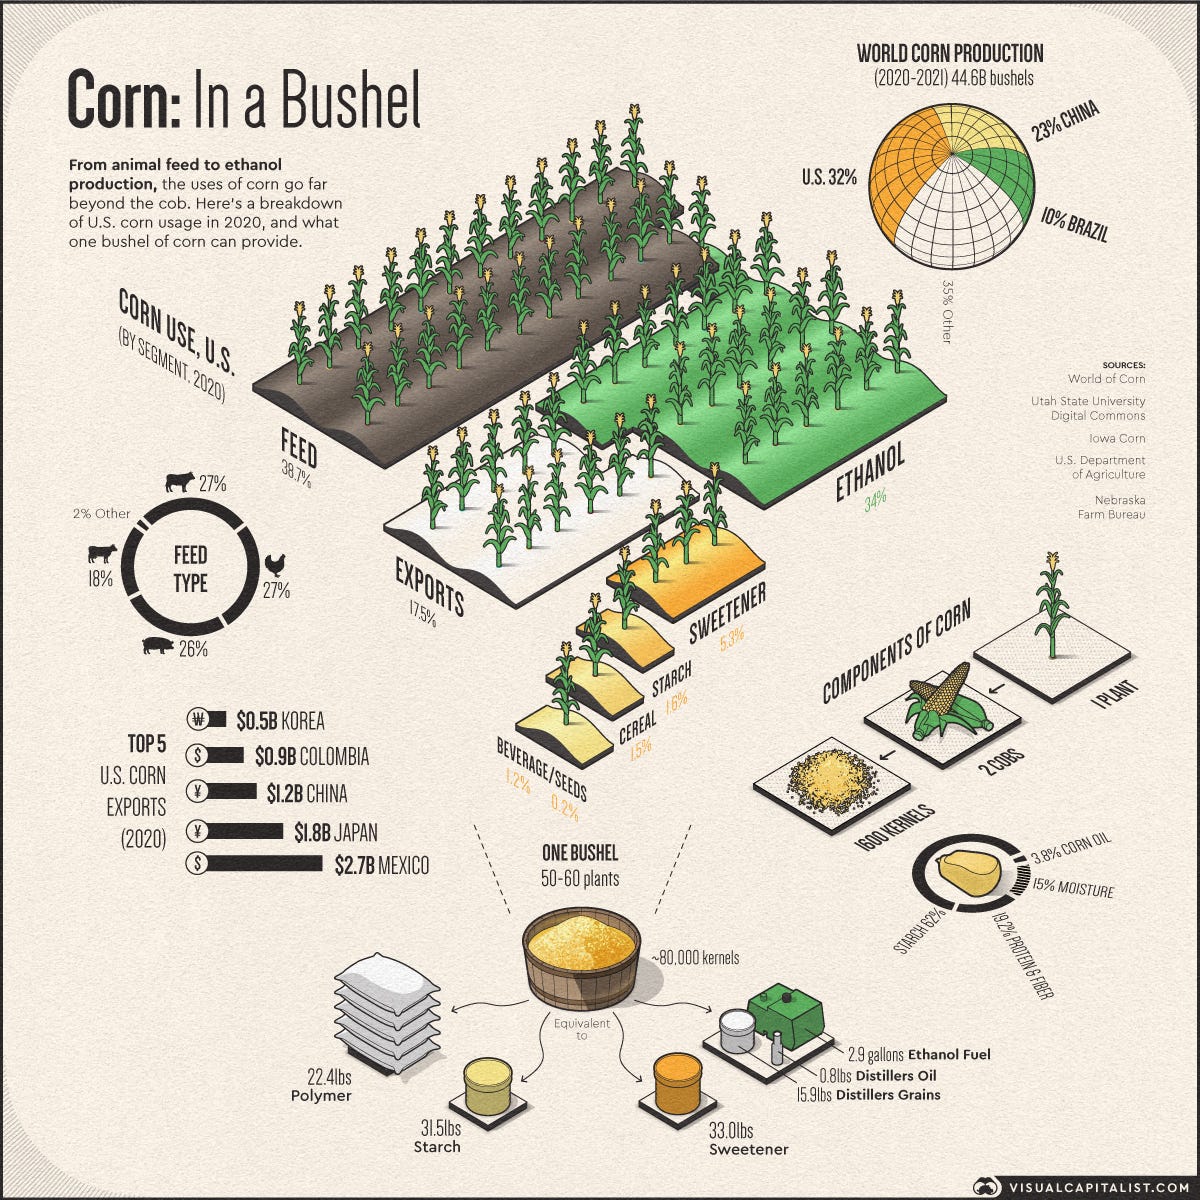
Corn, or maize, holds a pivotal position in the global agricultural economy, ranking as the second most-produced crop worldwide. Its pervasive influence extends significantly beyond direct human consumption, penetrating critical sectors globally. As a staple food, it forms a key ingredient in numerous processed food products, including cornmeal, cornflakes, and the ubiquitous high-fructose corn syrup.
Critically, corn serves as the primary energy component in livestock feed, representing nearly 40% of all corn utilization in the U.S. and over 96% of U.S. feed grain consumption. This extensive use renders it indispensable for the global meat and dairy industries, directly linking its price to protein production costs.
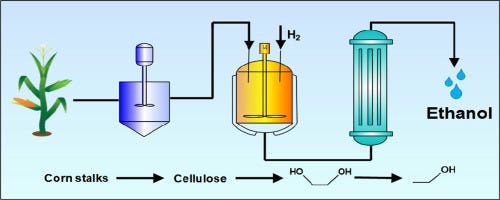
A substantial and growing portion of corn is dedicated to biofuel production, primarily ethanol. The United States leads global corn ethanol output, contributing approximately 55% as of 2021.
In the U.S., a significant share of corn, around 31% in 2020 and 94% of corn production, is channeled into ethanol, thereby directly connecting corn prices to energy markets and government mandates. This dual role as a critical food/feed source and a major biofuel input creates an inherent tension within the market. The more corn is diverted to ethanol due to policy mandates, the less elastic its overall demand becomes. This structural inelasticity means that even small yield deviations can lead to disproportionately large price swings in the food and feed sectors, creating food security concerns and inflationary pressures beyond what a purely food/feed-driven market might otherwise experience.
Beyond these primary uses, corn finds diverse industrial applications, including the production of starch, polymers, and alcoholic beverages. This broad utility underscores its economic impact and the widespread ripple effects of its price fluctuations across numerous supply chains, from groceries to gasoline.
Current Market Environment and Key Trends
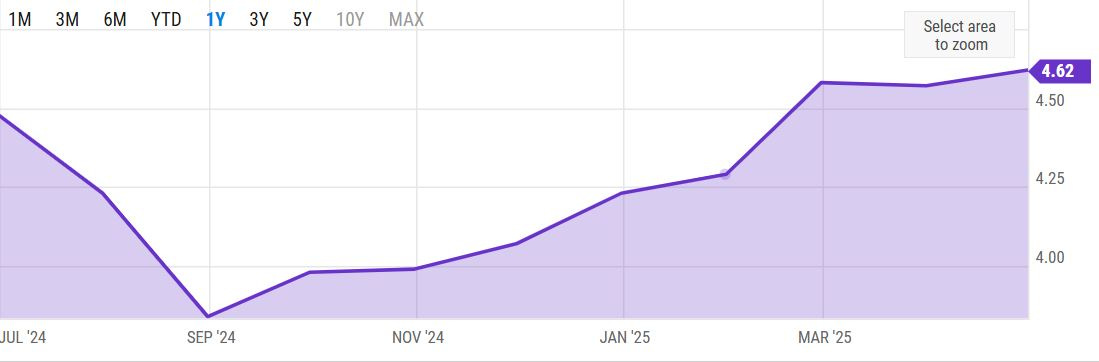
The contemporary corn market is characterized by a complex interplay of forces, resulting in notable price fluctuations. As of April 2025, the U.S. Corn Farm Price Received stood at $4.62 USD per bushel, reflecting a modest increase from the preceding month and year. However, this figure remains considerably below the peaks observed in mid-2022, when prices reached approximately $7.38 per bushel.

Recent reports from the Food and Agriculture Organization of the United Nations (FAO) indicate a sharp decline in global maize prices in May 2025. This downturn is primarily attributed to robust harvests and ample availability in Argentina and Brazil, coupled with expectations of a record crop in the United States. The FAO further forecasts global cereal production, including maize, to reach an unprecedented 2,911 million tonnes in 2025, representing a 2.1% increase from 2024.
Despite these generally bearish supply-side indicators, corn export commitments have surprisingly surged to a three-year high, signaling robust international demand. This demand is underpinned by factors such as China's recovering hog herds, which are driving increased demand for animal feed, and a strategic diversification of suppliers by Middle Eastern buyers amidst geopolitical uncertainties. The market is also contending with the ongoing impact of a strengthening U.S. dollar. A stronger dollar typically renders U.S. corn more expensive for international purchasers, potentially tempering export volumes despite strong underlying demand.
The simultaneous forecast of record global production and declining prices, which suggests a fundamentally bearish outlook, alongside surging export commitments and some bullish institutional positioning, presents a contradictory market picture. This indicates that while the long-term supply appears ample, strong underlying demand and short-term market participant actions are creating upward pressure or preventing steeper price declines.
This divergence points to a highly dynamic and potentially volatile market where short-term tactical trading opportunities may arise from demand surges or weather-related scares, even within a fundamentally bearish long-term supply environment. It also underscores the necessity of distinguishing between different types of market participants, as their strategies and time horizons may vary significantly.
Market Variables and Price Drivers
Supply-Side Dynamics
The supply of corn is influenced by a confluence of factors, with weather, yields, production costs, and stock levels being paramount.
Weather Conditions

Weather stands as the most significant and unpredictable variable dictating corn supply and, consequently, prices. Adverse climatic events such as droughts, floods, and extreme heat in major growing regions, including the U.S. Midwest, Brazil's Cerrado, and Eastern Europe can severely diminish yields and tighten global supply.
Primarily, the key variables to monitor when assessing weather conditions are:
Rainfall & Drought Conditions: Affecting corn yields in the U.S., Brazil, Argentina, and Ukraine.
Temperature Shifts: Impacting planting, growth, and harvest periods.
Pest & Disease Risks: Diseases like blight and pest infestations affecting global supply.

For instance, the 2012 drought in the U.S. resulted in a 13.2% reduction in production forecast for 2013, causing prices to surge dramatically.

Conversely, ideal weather conditions can lead to bumper crops and subsequent price declines, as demonstrated in 2014 when a mild summer facilitated a record harvest, driving prices down to $3.50 per bushel. The U.S. Corn Belt, which accounts for nearly 40% of global corn exports, faces a nuanced weather dynamic: while optimal rainfall can boost yields during the critical pollination phase, excessive moisture risks delaying harvests and fostering mold, adding a layer of uncertainty.
Yields and Production
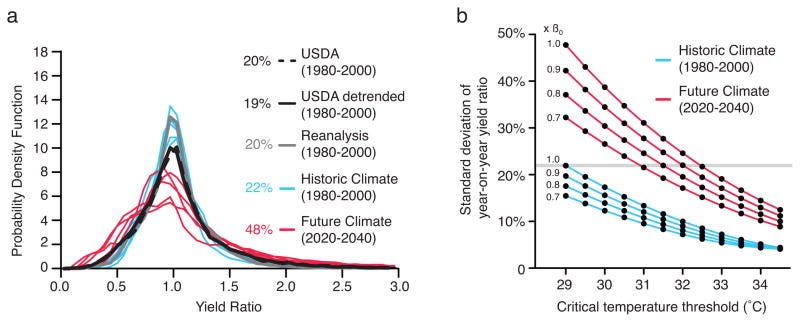
Global cereal production, including maize, is projected to reach new record levels in 2025, with the U.S. anticipated to increase maize output by 6.0% due to expanded sowings. Brazil's safrinha (second) corn crop is also forecasted for record yields. While overall yield variability has notably declined in the 21st century compared to the 20th century, particularly when excluding outlier events like the 2012 drought, it remains a critical concern.
Production Costs
The cost associated with corn production, encompassing material and service costs, labor, and land, directly influences its market price. Macroeconomic factors, notably energy prices for fuel and fertilizer, significantly impact these costs. Even indirect disruptions, such as geopolitical tensions in the Middle East, can elevate global input prices, thereby pressuring farmer margins. This means that seemingly distant conflicts have a tangible, direct financial impact on the agricultural sector by increasing operational costs, which can then ripple through the supply chain to influence end-consumer prices.
Stocks (Carryover Levels)
Ending stocks, or carryover levels, represent a crucial determinant of corn prices. The observed reduction in yield variability implies a decreased necessity for maintaining large strategic stocks.
However, current global stocks are projected to decline by 5% to 262.76 million tons in 2025/26, signaling tighter markets despite record production forecasts. This suggests that robust demand is effectively absorbing new supply, preventing a significant build-up of reserves.
The paradox of declining yield variability alongside falling global stocks implies a market operating with thinner buffers. While technological advancements and genetics might be reducing year-to-year yield swings, the market's capacity to absorb any unexpected supply shock is diminished due to these lower stock-to-use ratios. This makes the market structurally more vulnerable to sudden, severe price spikes from even moderate, localised supply disruptions, as there is less buffer to draw upon.
Demand-Side Dynamics
Corn's widespread demand stems from its diverse applications across various industries.
Food Industry
Although direct human consumption accounts for a small percentage of American corn production (less than 2%), corn remains a fundamental ingredient in numerous processed foods and a dietary staple in many global regions. The demand for cornmeal, flour, oil, and sweeteners like high-fructose corn syrup continues to be robust.
Livestock Feed
Animal feed constitutes the largest segment of corn usage, accounting for nearly 40% of total corn utilization in the U.S. and over 96% of U.S. feed grain consumption. The rising global consumption of meat, particularly in developing economies and driven by the recovery of China's hog herds (up 5% in Q2 2025), sustains strong demand for corn as an essential feed grain.
Ethanol Production
Corn ethanol represents a significant and growing demand driver, especially in the United States, which is the world's leading producer. Primarily blended with gasoline, ethanol use is often mandated by government policies in many countries. This demand is sensitive to fossil fuel prices and government incentives.
The U.S. ethanol industry is projected to consume 89 million tons domestically in 2025, with its production having steadily increased over the past four decades. The substantial and often mandated use of corn for ethanol means that periods of tight supply or high prices will inevitably reignite the "food vs. fuel" debate, a dynamic that has historically contributed to food commodity price shocks. This structural competition creates a socio-political risk layer on top of market volatility, compelling policymakers to balance energy independence goals with food security and affordability.
Industrial Uses
Beyond food and feed, corn is processed into various industrial products, including starch, polymers, and alcoholic beverages.
Global Importers
Key global corn importers include Japan, Mexico, South Korea, China, Egypt, Indonesia, the European Union, the Philippines, Vietnam, and Turkey. Each country's demand is driven by specific domestic needs, predominantly animal feed, but also food and biofuels. For instance, China's substantial import appetite in 2020 was a direct consequence of domestic supply shortages and surging demand for feed due to its recovering hog-herd population. The diversity of major importers and their specific demand drivers highlights complex, interconnected global demand patterns.
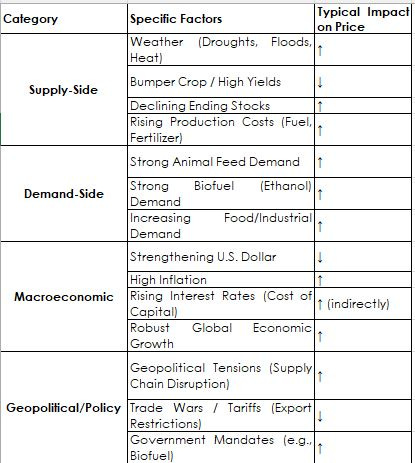
Key Drivers of Corn Prices
This table provides a structured overview of the myriad factors influencing the corn market.
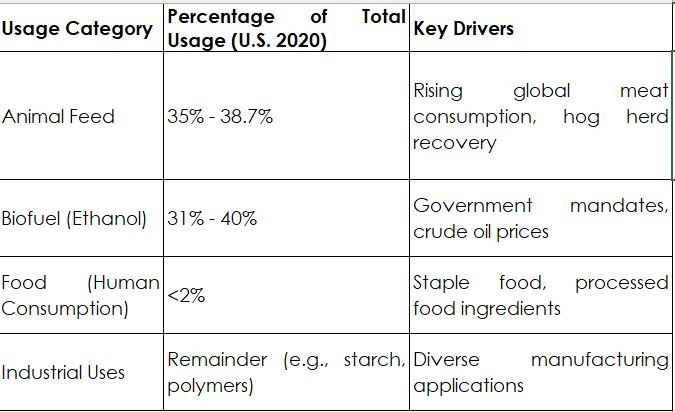
Global Corn Usage Breakdown (U.S. Example)
This table clarifies the demand structure for corn. By illustrating the proportion allocated to each use, It also visually reinforces the substantial allocation to biofuel, providing context for the "food vs. fuel" dynamic and its implications for price volatility.
Major Global Corn Importers
This table provides a clear geographical mapping of global corn demand.

Macroeconomic Influences
Corn prices are significantly shaped by broader macroeconomic forces, including the value of the U.S. dollar, inflation, interest rates, and global economic growth.
U.S. Dollar Value
Corn prices, like those of many other commodities, exhibit a strong inverse correlation with the U.S. dollar. A strengthening dollar typically renders U.S. exports more expensive for international buyers, potentially reducing demand and affecting export volumes. Conversely, a weaker dollar tends to support corn prices by making U.S. exports more competitive globally.
Inflation
Corn can serve as an effective hedge against inflation. During inflationary periods, the costs of various inputs essential for corn production, such as fuel and fertilizer, increase. These rising production costs are then passed on, pushing up corn prices. Broader macroeconomic conditions, including fiscal expansion and lax monetary policy, have historically fueled commodity booms.
Interest Rates (Cost of Capital)
The prevailing cost of capital, directly influenced by interest rates, significantly impacts investment in agricultural productive capacity. Higher interest rates can constrain future investment and growth in the sector, potentially limiting supply expansion over time. It is observed that U.S. interest rates follow long-term cycles, which can influence commodity price trends over extended periods.
Global Economic Growth
The overall trajectory of global economic growth, particularly in major agricultural importing nations, directly affects the demand for commodities like Corn. Robust economic expansion typically leads to increased consumption, while periods of slower growth or recession can reduce demand.
The presence of long-term cycles in geopolitical trends (a 53.5-year escalation cycle), interest rates (a 35-year cycle), and even solar activity (a 220-year cycle impacting weather volatility) suggests that corn prices are not merely subject to short-term fluctuations but are embedded within broader macroeconomic and environmental "supercycles". These long-term cycles create macro regimes that dictate the prevailing environment for commodity prices. For example, periods characterized by geopolitical escalation and higher interest rates can lead to increased inflationary pressures and a constrained ability to expand supply, thereby creating a structural tailwind for commodity prices. This perspective moves beyond short-term supply/demand analysis to a more strategic understanding of investment in corn, suggesting that allocating capital to corn can serve as a hedge against specific macro risks that are part of these larger cycles.
Geopolitical and Trade Policy Impacts
Geopolitical developments and trade policies wield considerable influence over the corn market, often creating significant volatility.
Geopolitical Tensions
Global geopolitical tensions, such as rising tensions in the Black Sea region or conflicts in the Middle East, can profoundly disrupt grain markets. While the U.S. may not directly rely on oil from the Middle East, such tensions invariably impact global fuel, fertilizer, and freight prices, all of which are critical inputs for agricultural production.
This leads to indirect pressure on farmer margins and can result in tightening supplies and higher prices across the board. Ukraine and Russia collectively account for nearly a quarter of global wheat, maize, and barley exports, making their resilience and adaptability in times of conflict crucial for global supply stability.
Geopolitical events act as direct stressors on agricultural supply chains, not just through direct trade bans but more insidiously through increased input costs and logistical disruptions. The observed shift towards prioritizing supply over price in global trade underscores this dynamic, meaning that geopolitical risk assessment for corn extends beyond direct trade relationships to encompass global energy and logistics networks.
Trade Wars and Tariffs
Trade wars, exemplified by those initiated by the previous U.S. administration, have direct and severe repercussions for U.S. agricultural exports, including corn. Retaliatory tariffs, such as China's 15% tariff on U.S. corn, resulted in significant export losses for American farmers. While U.S. export values largely recovered within 2-3 years, the experience prompted major importers like China to actively diversify their supply sources to shield themselves from future trade disruptions. This long-term strategic diversification can permanently alter global trade flows and market shares, even if bilateral relations improve, creating a structural headwind for U.S. exports in the long run.
Government Policies
Beyond trade wars, government policies such as agricultural subsidies, import/export restrictions, and biofuel mandates play a critical role in shaping corn market dynamics. For instance, the Energy Policy Act of 2005 mandated ethanol blends, effectively guaranteeing a substantial portion of demand for corn ethanol. These policy interventions can create artificial demand floors or supply constraints, influencing price levels and market stability.
Market Structure and Participants
Key Market Participants
The corn market is a complex ecosystem involving various participants, each possessing distinct motivations and impacts on price dynamics.
Producers (Farmers)
These are the primary cultivators of corn, fundamentally concerned with selling their harvest at advantageous prices to ensure profitability. Farmers inherently hold a "long" position in the cash market, meaning their revenue diminishes if prices fall. To mitigate this price risk, they frequently employ futures contracts to "short hedge," effectively locking in a price floor for their future sales.
Consumers/Processors
This category includes a wide array of entities such as livestock producers, ethanol plants, and food manufacturers, all of whom require corn as a vital input for their operations. Their primary concern is protecting against rising corn prices. They often engage in "long hedging" by purchasing futures contracts to secure their future purchase prices. Grain elevators also play a crucial intermediary role, often simultaneously buying from farmers and selling to processors, utilizing hedging strategies to manage their inventory risk effectively.
Hedgers
This broad classification encompasses both producers and consumers who strategically utilize futures and options markets to mitigate price risk inherent in their physical commodity operations. Their objective is to forgo some potential profit in exchange for a reduction in overall risk exposure.
Speculators
These market participants enter the corn market with the primary aim of profiting from anticipated price movements, without any intention of taking or making physical delivery of the commodity. They willingly assume the price risk that hedgers seek to transfer, in pursuit of higher returns.
Speculators encompass a diverse group, ranging from large institutional players, such as Managed Money funds and hedge funds, to smaller, non-reportable traders.
The collective positioning of these speculative entities, as revealed by the Commitment of Traders (COT) report, offers valuable insights into prevailing market sentiment and potential future price direction. The futures market fundamentally functions as a risk transfer mechanism, allowing hedgers to offload price risk to speculators. The balance of these net positions directly influences the term structure of futures prices.
For instance, if hedgers are net short, futures prices might be a downward-biased estimate of future spot prices, creating an incentive for speculators to go long. Understanding the composition of open interest, particularly the distinction between commercial and non-commercial positions in the COT report, is therefore crucial for gauging the underlying structural forces at play in the market, beyond mere directional bets.
Spot Market Operations and Physical Delivery
The spot market refers to the immediate cash price of corn at a specific geographic location. This represents the price at which physical corn is bought and sold for immediate delivery, reflecting current local supply and demand dynamics.

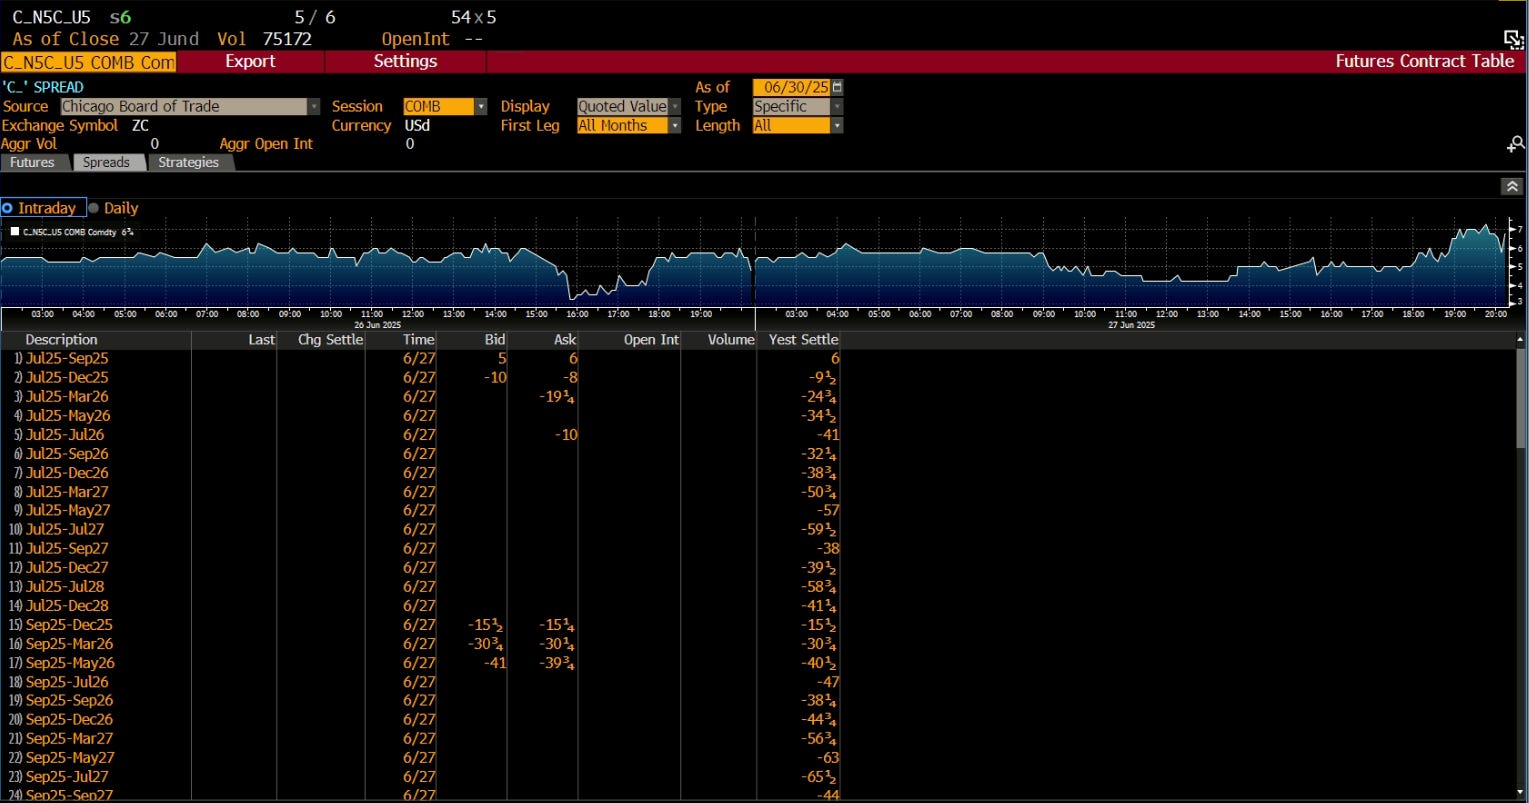
Physical delivery serves as the ultimate settlement mechanism for many corn futures contracts, particularly those traded on the CME. The intricacies of this delivery process are a significant driver of the price spreads observed between different futures month contracts and determine whether the market exhibits a "carry" (contango) or an "inverse" (backwardation).
The physical delivery system ensures that the CME futures price accurately reflects the actual price of physical grain at a defined location at a specific point in time. For example, deliverable stocks of corn located near Chicago are typically valued with a near zero-basis level, indicating a close alignment between cash and futures prices at that central delivery point.
The process of physical delivery commences when a futures contract transitions into a "delivery receipt" during a specific window, typically a 10-trading-day period beginning approximately one business day prior to the 15th of the contract month. Holders of these delivery receipts are presented with several options:
They can arrange for the physical grain to be loaded out (often via barges, which hold 55,000 bushels and serve as a de facto export delivery mechanism)
Redeliver the receipt back into the market, or elect to pay storage fees to the CME until a later date.
The mechanics of physical delivery, including storage costs, transportation logistics, and the choices available to delivery receipt holders, directly influence the relationships between spot and futures prices, as well as across different futures maturities. These physical constraints and choices create economic incentives that shape the futures curve.

For instance, if storage is expensive or capacity is tight, it can push nearby futures prices higher relative to deferred ones (backwardation), reflecting the premium for immediate physical access. Conversely, if there is ample storage and limited demand for immediate delivery, carry costs will dominate, leading to contango. Understanding these physical market realities is therefore essential for accurately interpreting futures prices, particularly the term structure and basis, and for identifying potential arbitrage opportunities that arise from price discrepancies.
Futures Market Mechanics
Corn futures contracts are highly standardized agreements to buy or sell a specified quantity of corn at a predetermined price on a future date. Full-sized contracts typically represent 5,000 bushels, while mini contracts represent 1,000 bushels.

These contracts are predominantly traded on the Chicago Board of Trade (CBOT), which operates under the umbrella of the CME Group, serving as the primary global exchange for corn futures. Trading hours are extensive, encompassing both electronic (CME Globex) and open outcry sessions, allowing market participants to react swiftly to global events and news almost around the clock.
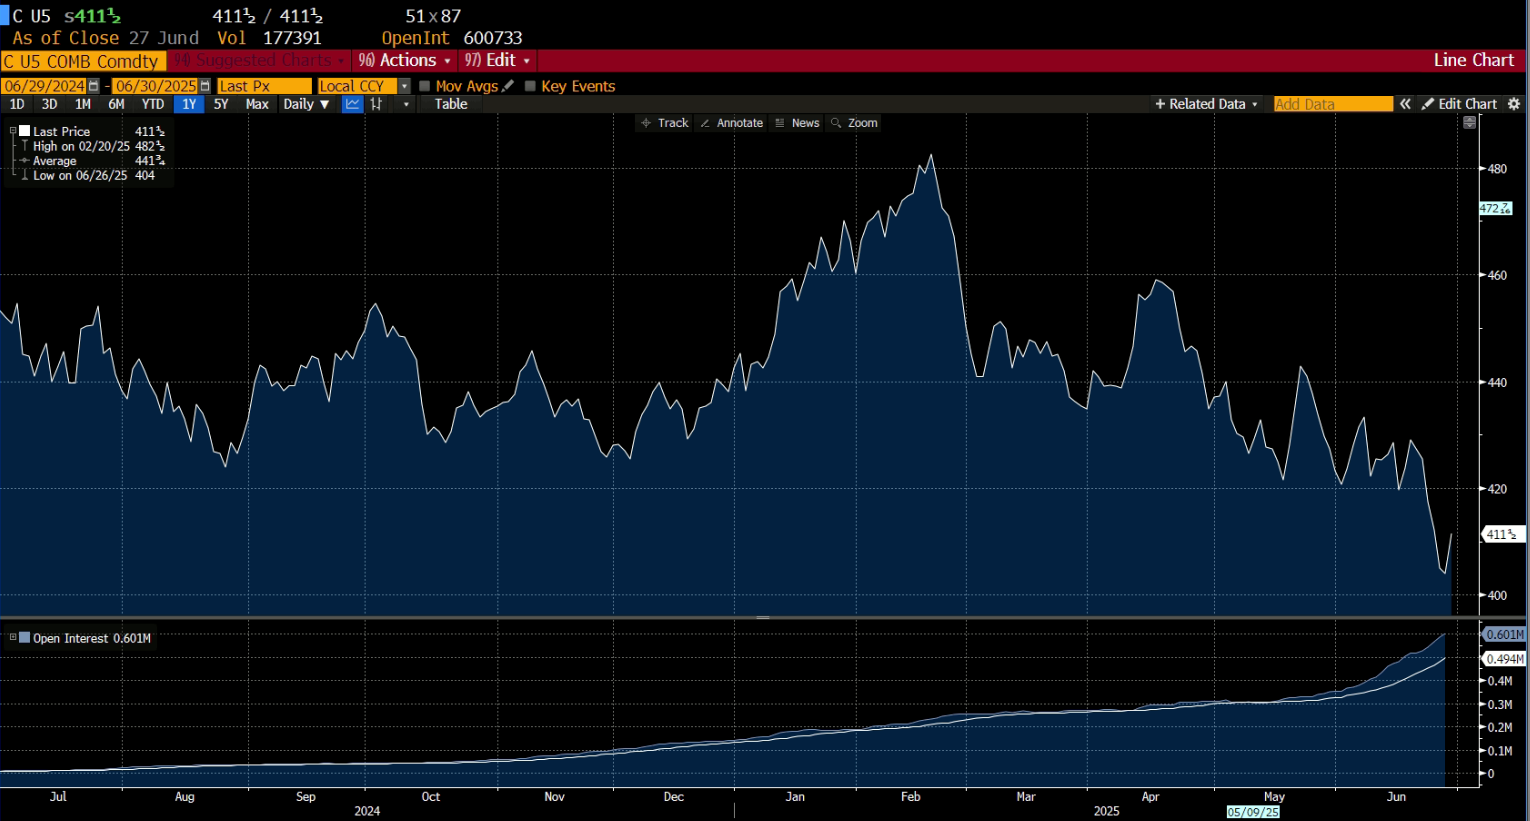
Corn futures are characterized by their exceptional liquidity, with the full-sized ZC contract consistently posting an average daily volume exceeding 350,000 contracts and a peak open interest of 1.7 million. This high liquidity ensures efficient price discovery and ease of entry and exit for traders.
Furthermore, listed contracts typically include key agricultural months such as March, May, July, September, and December maturities, aligning with planting and harvest cycles. The minimum price fluctuation, or "tick," for corn futures is 1/4 of one cent per bushel, which translates to a value of $12.50 per contract.
The existence of highly liquid, standardized futures contracts on major exchanges like the CBOT provides a centralized and transparent point of global price discovery for corn. This allows market participants worldwide to efficiently manage risk and speculate based on a universally recognized price. The standardization and liquidity reduce transaction costs and increase market depth, making it easier for a wide range of participants, from individual farmers to large institutional funds, to enter and exit positions.
Term Structure Analysis
The term structure of corn futures describes the relationship between futures prices for contracts with different maturities. This relationship provides critical signals about market expectations regarding future supply and demand.
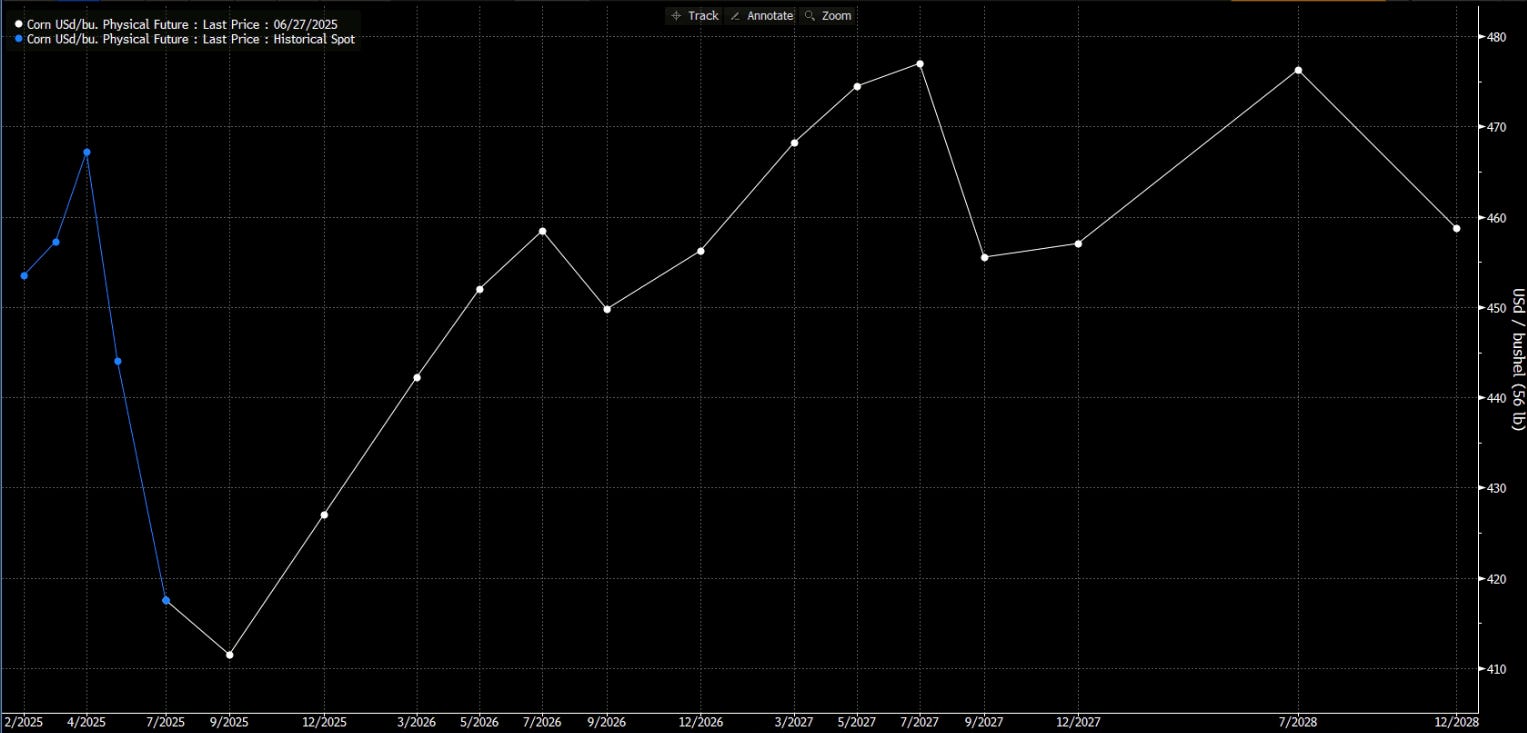
Contango
This is considered the "normal" market condition, characterized by futures prices for longer-dated contracts being higher than those for nearer-term contracts or the current spot price. This results in an upward-sloping futures curve. The primary driver of contango is the "cost of carry," which encompasses the expenses associated with holding the physical commodity over time, including storage fees, insurance, and financing costs. In a market exhibiting contango, rolling an expiring long futures contract into the next month typically results in a "roll loss," as the new, longer-dated contract is purchased at a higher price than the expiring one was sold.
Backwardation
This is a less common but significant market condition where near-month or front-month futures contracts trade at higher prices than longer-dated ones, leading to a downward-sloping futures curve.
Backwardation typically signals strong immediate demand, limited current supply, or a perceived sense of scarcity, where an "availability premium" is paid for prompt delivery. In a backwardated market, rolling a long futures contract can generate a "roll profit," as the expiring contract is sold at a higher price than the new, longer-dated contract is purchased.
Roll Yield
This refers to the profit or loss generated when an expiring futures contract is closed out and a new contract with a later maturity date is opened to maintain a continuous position. Roll yield is positive in a backwardated market and negative in a contango market.
The term structure is a powerful market signal reflecting the immediate and anticipated supply-demand balance. Backwardation indicates current tightness or perceived future scarcity, while contango suggests ample supply or efficient storage. The market's pricing of future delivery relative to current spot (or near-term futures) directly reflects the economic incentives for holding or releasing physical inventory.
A backwardated market incentivizes immediate sale and disincentivizes storage, whereas a contango market incentivizes storage. Traders utilize term structure analysis to inform carry trades, identify potential trend reversals , and understand the market's perception of future supply conditions. It serves as a key input for factor-based strategies such as Basis Momentum.
Basis Dynamics and Factors
Basis is defined as the difference between the local cash price of corn and the price of a specific futures contract, typically the one with the closest delivery month. This differential reflects the unique supply and demand conditions prevalent in a specific local market relative to the broader, centralized futures market.
Key Factors Influencing Basis
Transportation Costs: This is the most significant component of basis, accounting for the expense of moving corn from a local origin point to a central market or an export destination. Locations situated farther from major delivery points or processing centers typically exhibit a more negative (weaker) basis, as the higher transportation costs reduce the local cash price relative to the futures price.
Storage and Interest Costs: These costs accrue over time as grain is held in inventory. Consequently, cash prices tend to increase from harvest into the following summer to compensate for the accumulating expenses of storage and the interest on capital tied up in unsold grain.
Local Supply and Demand: The balance of supply and demand within a specific geographic area profoundly impacts basis. Heavy farmer selling, particularly immediately after harvest, tends to depress local cash prices and widen the basis (making it more negative) due to an abundance of local supply. Conversely, light farmer selling or strong local demand, such as from nearby biofuel processing plants or large livestock operations, can strengthen the cash price and narrow the basis. The expansion of biofuel production, for example, has altered historical basis patterns in some regions by increasing local demand.
Geographic Variations: Basis patterns are not uniform and vary considerably by region, primarily due to differing transportation costs, proximity to end-users, and unique local supply/demand dynamics.
Grain Quality: Although less common, instances of marginal grain quality within a specific region can also contribute to a weaker basis, as buyers may discount prices for lower-grade corn.
Understanding basis is critical for agricultural producers and merchandisers, as it allows them to convert a futures price into an expected local cash price, which is essential for effective hedging and marketing decisions.
Quantitative Factors and Trading Strategies
Convenience Yield
Convenience yield is a crucial concept that elucidates the hidden benefits derived from holding a physical commodity, such as corn, rather than merely possessing a futures contract representing ownership of that commodity. It embodies the practical value of having immediate access to the actual product, enabling companies to make swift adjustments to meet unexpected needs, minimize operational delays, or maintain stability during periods of market uncertainty.
This yield is not a direct cash flow or a specific balance sheet entry. Instead, it explains why market participants are often willing to pay higher prices for spot commodities compared to future delivery. The most critical determinant of convenience yield is the level of inventory.

A decrease in inventory levels significantly increases the value of holding physical commodities, as immediate access to resources becomes paramount under unforeseen market conditions. Conversely, when inventory levels are high, the urgency in the market diminishes, resulting in a reduced convenience yield. Storage capacity also plays a role; in areas with restricted storage, the expense of holding additional commodities rises, benefiting those who can manage current supply availability efficiently.
Convenience yield acts as a compensation against the total carrying costs, which include storage expenses, insurance, and financing costs that accumulate until a contract's expiration date. When convenience yield is high, it can offset or even exceed the total cost of carry, leading to a situation where the futures price falls below the spot price, a market condition known as backwardation. Conversely, in markets with minimal convenience yield and low risk, carrying costs are fully applicable, causing the futures price to exceed the spot price, a condition known as contango. A high convenience yield often serves as a market signal, warning traders to reassess their positions and adjust market expectations, indicating potential market instability, delivery challenges, or rising demand for nearby products.
Backwardation and Contango
The concepts of backwardation and contango describe the fundamental shapes of the futures curve, reflecting the market's expectations and the underlying supply-demand dynamics.
Contango
This market structure is characterized by an upward-sloping futures curve, where prices for deferred futures contracts are higher than those for nearer-term contracts or the current spot price. The primary economic explanation for contango is the "cost of carry," which includes the expenses associated with storing, insuring, and financing the physical commodity over time. In a contango market, a long position that is "rolled" from an expiring contract to a new, longer-dated contract will incur a "roll loss," as the new contract is purchased at a higher price. This scenario typically occurs when there is ample supply and efficient storage, and future buyers are not concerned about immediate availability.
Backwardation
This market structure is characterized by a downward-sloping futures curve, where near-month or front-month futures contracts trade at higher prices than longer-dated ones, and often higher than the spot price. Backwardation typically signals strong immediate demand outpacing current supply, a sense of scarcity, or tight inventory levels, where market participants are willing to pay a premium for immediate delivery (the "availability premium" or high convenience yield). In a backwardated market, rolling a long futures contract can generate a "roll profit," as the expiring contract is sold at a higher price than the new, longer-dated contract is purchased. This situation often signals a strong trend reversal in the market.
Understanding the term structure is crucial for traders. It provides direct signals about the market's perception of current and future supply-demand imbalances. A backwardated market incentivizes immediate sale and disincentivizes storage, while a contango market incentivizes storage. This dynamic is central to carry trades and forms a basis for more complex factor-based strategies.
Volume and Open Interest
Volume and open interest are key technical indicators used in conjunction with price action to gauge market sentiment and the strength of price trends in corn futures.
Volume
Represents the total number of futures contracts that have changed hands during a specific trading session, typically a day. Higher trading volume indicates greater market activity and participation, suggesting a stronger conviction behind a price movement. For corn futures, average daily volume can be upwards of 350,000 contracts, indicating a highly active market.
Open Interest (OI)

Represents the total number of futures contracts that are currently "open" or outstanding, meaning they have been entered into but not yet closed out by an offsetting trade or physical delivery. Unlike trading volume, which measures activity over a period, open interest provides a snapshot of the total number of active positions at a given time. For corn futures, open interest can range significantly, with peaks around 1.7 million contracts.
Interpretation:
Increasing Open Interest: Generally indicates that new money is flowing into the market, as more traders are opening new positions than closing existing ones. When accompanied by rising prices, increasing open interest is typically interpreted as a bullish sign, confirming the strength of the uptrend due to new buying interest. If prices are falling with increasing open interest, it can indicate aggressive new short-selling, suggesting a continuation of the downtrend.
Decreasing Open Interest: Suggests that money is flowing out of the market, as more positions are being closed than opened. When prices are rising but open interest is declining, it often indicates that the rally is driven by short sellers covering their positions rather than new buying, which is generally considered a bearish sign as money is leaving the marketplace. If both prices and open interest are declining, it may indicate that long position holders are being forced to liquidate, and some analysts view this as a potential sign that the downtrend is nearing exhaustion.
Analyzing volume and open interest in conjunction with price action provides a deeper understanding of market dynamics beyond simple price charts, helping to confirm the sustainability of trends and anticipate potential reversals.
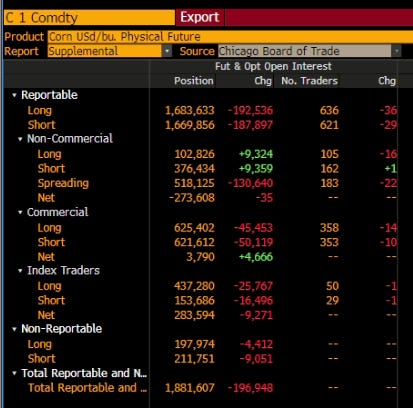
Commitment of Traders (COT) Report

The Commitment of Traders (COT) report, published weekly by the Commodity Futures Trading Commission (CFTC), provides a breakdown of open interest in various futures markets, including corn, by different categories of traders. This report is a crucial tool for understanding market sentiment and positioning.
Trader Categories
The COT report typically disaggregates traders into several key categories:
Commercial Traders (Producer/Merchant): These are entities that use futures markets primarily for hedging their physical commodity exposure, such as farmers, grain elevators, and processors. Their positions reflect genuine supply and demand dynamics in the underlying physical market.
Non-Commercial Traders (Managed Money/Large Speculators): This category includes large institutional investors, hedge funds, and commodity trading advisors (CTAs) who primarily trade for speculative purposes. Their positions often reflect directional bets based on technical or fundamental analysis.
Non-Reportable Positions: This represents the aggregate positions of smaller traders who do not meet the CFTC's reporting thresholds. This group is generally considered to be small speculators and hedgers.
Interpretation

The COT report offers insights into the psychology of the marketplace and potential future price movements.
Managed Money Sentiment: A significant net long position by Managed Money often signals a bullish outlook, indicating expectations of price gains driven by strong demand or potential supply constraints. Conversely, a large net short position suggests bearish sentiment. For instance, recent data showed Managed Money with a net long position of +228,806 contracts in corn, with a sharp weekly increase in long positions and a decrease in short positions, signaling a bullish outlook. This suggests that these large speculators anticipate price gains, likely driven by strong demand or perceived supply constraints.
Contradictory Positioning: It is important to note that while some "Managed Money" reports indicate bullish sentiment, other "hedge funds" have been increasing their short bets, pushing net short positions to their highest level since early September. This divergence could reflect different time horizons or specific strategies employed by various funds, where some are taking short-term tactical bets while others maintain a longer-term fundamental view. This highlights the complexity of interpreting aggregated data and the need for nuanced analysis.
Spreading Activity: An increase in spreading positions often suggests heightened hedging or speculative activity, reflecting uncertainty or positioning ahead of significant market events.
Market Dynamics: A strong bullish stance by Managed Money, combined with increased total open interest, can indicate a more active market with elevated liquidity and potential for volatility. Growth in non-reportable positions can point to rising participation by smaller traders, potentially increasing market unpredictability.
Analysts monitor changes in net positions and open interest to identify prevailing trends and potential reversals. For example, a classic bullish setup occurs when large traders are net long and small traders are net short. Conversely, a bearish setup is indicated when large traders are net short and small traders are net long.
Market Index and Options Market
Corn's role extends to broader financial instruments, including commodity market indices and a robust options market, which provide additional avenues for investment, hedging, and price discovery.
Commodity Market Indices
Corn is a significant component of various commodity indices, such as the S&P GSCI or Bloomberg Commodity Index. These indices provide diversified exposure to the commodities asset class, allowing investors to track broad market performance. Investing in commodity indices can offer strategic benefits, including equity-like returns, inflation-hedging properties, and risk diversification, as commodity prices often exhibit low correlation with traditional asset classes like stocks and bonds.
Options Market
The corn options market provides participants with flexible tools for hedging and speculation. Options contracts give the holder the right, but not the obligation, to buy (call option) or sell (put option) a corn futures contract at a specified price (strike price) before a certain date.
Hedging: Producers can buy put options to establish a price floor, protecting against falling prices while retaining upside potential. Consumers can buy call options to cap their purchase price, hedging against rising costs.
Speculation: Traders can use options to speculate on price movements with limited risk (to the premium paid) and potentially higher leverage compared to direct futures trading.

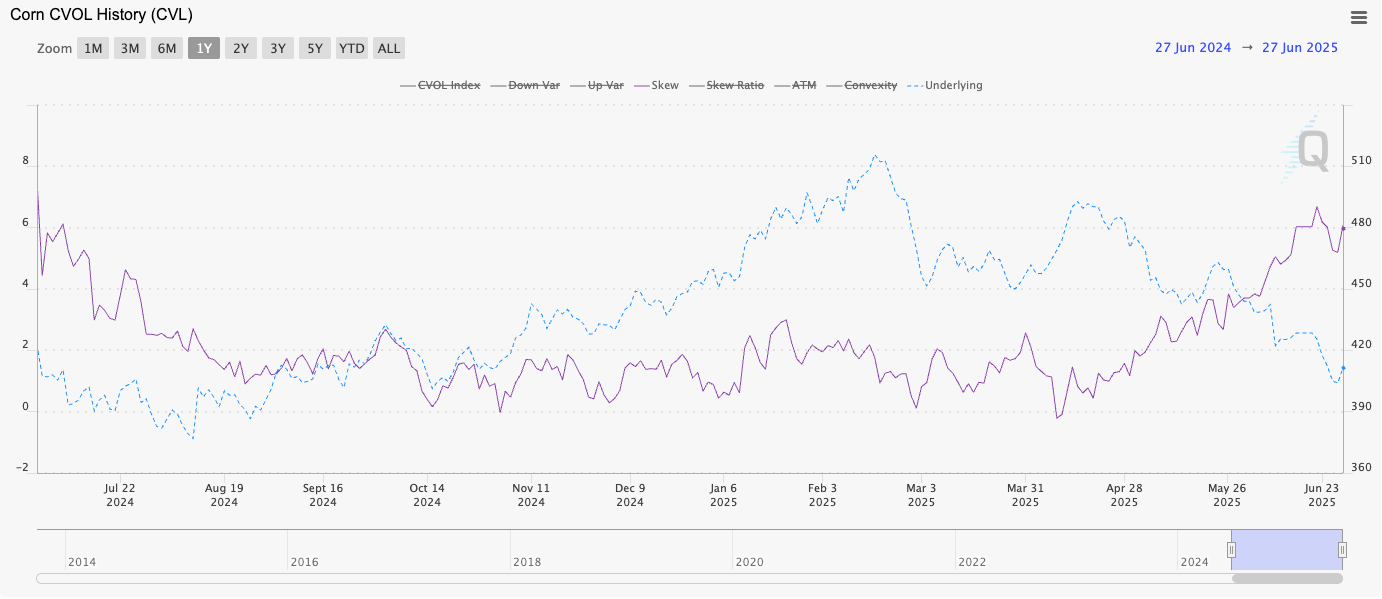
Implied Volatility (CVOL): The CME Group Volatility Index (CVOLTM) for corn (CVL) is a robust measure of 30-day implied volatility, derived from deeply liquid options on corn futures. Implied volatility reflects the market's forward-looking expectation of future price swings. A rising CVOL indicates increased anticipation of price volatility. For example, corn implied volatility recently rose sharply to a one-month high of 30.72.

Skewness: The CVOL Skew, which measures the difference in implied volatility across different strike prices, provides further insights into market expectations for large price movements. A higher skew can indicate a market's concern about outsized moves in one direction. Analyzing implied volatility and skew is crucial for understanding market risk perceptions and for constructing options trading strategies.

Factor Profile Trading/Investing
Beyond traditional fundamental and technical analysis, quantitative factor-based strategies have gained prominence in commodity markets, including corn, by systematically exploiting market inefficiencies and risk premia.
Momentum Factor
Momentum trading capitalizes on the continuation of existing price trends. In commodities, this strategy typically involves buying futures contracts that have outperformed in the recent past and selling those that have underperformed, holding these positions for a specified period (e.g., up to 12 months).
Momentum strategies in commodities are attractive due to relatively low transaction costs, trading in liquid contracts, and the absence of short-selling restrictions often found in equity markets. Momentum returns in commodities are also observed to have low correlations with traditional asset classes, making them valuable for portfolio diversification.
Furthermore, research suggests that commodity momentum returns are linked to the propensity of futures markets to be in backwardation or contango, implying that momentum strategies often buy backwardated contracts and sell contangoed ones.
Basis Factor
Basis trading is a strategy built around the difference between a commodity's spot price and its futures price. Traders can go "long the basis" if they expect this difference to widen, or "short the basis" if they anticipate it will narrow. This strategy is particularly common in agricultural futures, where producers and elevators use it to hedge production costs and manage inventory.
For example, an elevator buying corn from a farmer at a local cash price and simultaneously selling futures to lock in a spread is "long the basis," aiming for the cash price to gain relative to the futures price. This strategy exploits local supply and demand conditions relative to the broader futures market.
Basis Momentum Factor
This is an advanced return predictor derived from the slope and curvature of the futures term structure.
Basis-momentum is measured as the difference between momentum in first- and second-nearby futures strategies. It has demonstrated strong outperformance in predicting commodity spot and term premiums across various dimensions (cross-section, time series, and maturity).
The underlying economic rationale is that basis-momentum captures imbalances in the supply and demand of futures contracts that materialize when the market-clearing ability of speculators and intermediaries is impaired. It represents compensation for priced risk and has been shown to capture risks orthogonal to traditional factors like basis and momentum, making it a powerful addition to commodity factor pricing models.
Skewness
The skewness of commodity futures returns can contain valuable information about subsequent returns. Research suggests a negative skewness-expected returns relationship in commodity futures, meaning that commodities with the most negative skew tend to offer higher expected returns. This is theorized to be because investors may prefer assets with positive skew (lottery-like payoffs) and avoid those with negative skew (higher probability of large losses), leading to mispricing. A trading strategy could involve taking long positions in commodity futures exhibiting the most negative skew and short positions in those with the most positive skew to generate excess returns.
Inflation Beta
While a specific "inflation beta" for corn is not provided, corn, like other agricultural commodities, is generally considered an effective hedge against inflation. During periods of rising inflation, the cost of production inputs increases, and the value of physical assets tends to rise, making corn a natural store of value against currency devaluation. Investors often buy corn futures or call options during inflationary periods as a viable strategy to mitigate the impact of inflation.
Volatility
Volatility is an inherent characteristic of the corn market, driven by a multitude of factors including unpredictable weather patterns, geopolitical events, and shifts in supply and demand.
The CME Group's CVOL Index provides a forward-looking measure of 30-day implied volatility for corn, reflecting market participants' expectations of future price swings. High volatility creates both risks and opportunities for traders, necessitating robust risk management strategies. The interplay of weather and export logistics, for example, is identified as a twin engine of price volatility in the corn market.
Risk Management and Strategic Positioning
Effective risk management and strategic positioning are paramount for navigating the inherent volatility and complexities of the corn market.
Hedging Pressure
Hedging is a fundamental strategy employed by market participants to protect against price risk in the corn market.
Producer Hedging (Short Hedge): Grain farmers, who are implicitly "long" the cash market, use short hedges by selling corn futures contracts. This acts as a temporary substitute for selling physical corn, allowing them to lock in a price floor for their anticipated harvest and protect against potential price declines. The hedge is typically "lifted" by buying back the futures position when the physical grain is sold in the cash market. While hedging reduces price risk, it exposes the hedger to "basis risk," the risk that the cash price and futures price do not move in perfect tandem.
Processor Hedging (Long Hedge): Grain processors, livestock producers, or other consumers of corn, who are implicitly "short" the cash market (concerned about rising prices), engage in long hedges by buying futures contracts. This allows them to lock in a purchase price and protect against rising input costs.
Margin Requirements: To maintain a position in the futures market, hedgers must deposit "margin money" with their trading firm. This includes an "initial margin" to open the position and a "maintenance margin" that must be sustained in the account. If the market moves unfavorably, leading to a loss in the futures position, a "margin call" may be issued, requiring additional funds to bring the account back to the initial margin level. These margin calls should be viewed as part of the cost of insuring against major price movements.
Leverage Control
Futures contracts offer significant leverage, allowing market participants to control a large value of a commodity with a comparatively small amount of capital. For example, a full-sized corn contract represents 5,000 bushels, but the initial margin requirement might be only 5-15% of the total contract value.
While leverage can amplify potential profits, it also dramatically magnifies losses. Over-reliance on leverage is a common mistake that can lead to substantial financial exposure. Disciplined leverage control is therefore critical for managing risk effectively. This involves understanding initial and maintenance margin requirements, being prepared for potential margin calls, and sizing positions appropriately to align with one's risk tolerance.
Macro Hedging
Beyond direct commodity hedging, agricultural businesses can employ more sophisticated "macro hedging" strategies to manage broader price risks and enhance revenue stability.
Spread Trading: This involves taking simultaneous positions in two or more related futures contracts to profit from changes in the price difference between them. For instance, a trader might go long on one corn futures contract and short on another, betting that the price difference will widen or narrow. This strategy can reduce overall risk compared to a naked directional position and capitalize on relative price movements.
Ratio Hedging: A specific type of spread trading, ratio hedging involves hedging a position in one commodity with a position in another, related commodity. For example, a farmer might hedge a corn position by taking a position in soybean futures, given the historical correlation between their prices. Studies have shown that ratio hedging can effectively reduce the variance of returns, improving cash flow and revenue stability for agricultural businesses.
These advanced hedging techniques are crucial for managing basis risk, which is the risk that the futures price will not move perfectly in line with the cash price of the underlying commodity. By strategically managing price risks, businesses can take advantage of market opportunities and improve their competitiveness.
Positioning and Seasonal Tendency
Market positioning and seasonal tendencies are important considerations for traders and producers in the corn market.
Seasonal Tendencies: Corn prices often exhibit predictable seasonal patterns. Prices typically reach a low during the November harvest due to the influx of new supply, and the trade tends to be subdued throughout the winter. Conversely, the summer months, particularly June to August, can be highly volatile due to corn's sensitivity to weather conditions during critical growth phases like pollination. Unfavorably hot, dry weather in July can drastically interfere with pollination and send harvest yields plunging, leading to price spikes. Historically, corn futures have struggled during the summer months, with June, July, and August posting average declines over the past decade.
Market Positioning: The collective positioning of market participants provides insights into prevailing sentiment. For example, hedge funds and other large traders have recently been increasing their bets against corn, pushing the net short position to its highest level since early September. This indicates that a significant portion of institutional capital is betting on falling prices rather than a rebound. Producers often use futures or options contracts to hedge against these anticipated seasonal price drops after planting, thereby shielding themselves from potential declines if the weather favors a large crop. While seasonal patterns are predictable, they are not absolute and can be disrupted by unexpected events such as shifts in global demand (e.g., from China) or unforeseen trade deals. Therefore, continuous monitoring of real-time data and fundamental shifts is essential.
Conclusions.
Fundamentally, corn prices are driven by the delicate balance of supply and demand. While recent forecasts indicate a shift towards record global production for 2025, robust international demand, particularly from China's recovering livestock sector and Middle Eastern countries diversifying their food security, is absorbing this new supply. This prevents a significant accumulation of global stocks, leaving the market with thinner buffers and consequently more susceptible to sudden price spikes from unexpected supply shocks.
A key structural element amplifying this volatility is the substantial and often mandated diversion of corn to ethanol production. This creates an inelastic demand component that disproportionately magnifies price responses to climate-induced yield variations. Even seemingly minor weather events can trigger outsized price swings, underscoring the critical interplay between energy policy and agricultural market stability.
Geopolitical tensions, even in regions not directly involved in corn trade, exert significant indirect pressure by elevating global fuel, fertilizer, and freight costs. This directly impacts farmer profitability and the overall supply chain. Furthermore, past trade wars have fundamentally altered global trade norms, prompting major importers to strategically diversify supply sources, which could lead to long-term shifts in market shares for key exporters.
From a market structure perspective, the interplay between the "cost of carry" and "convenience yield" dictates the term structure of corn futures. Understanding whether the market is in contango or backwardation provides crucial signals about immediate supply tightness or ample storage, influencing roll yield and arbitrage opportunities. Beyond these, quantitative factors such as momentum, basis, and the more advanced basis-momentum and skewness offer distinct trading signals, suggesting that market inefficiencies related to liquidity provision and speculator behavior can be systematically exploited.
This report coupled with previous research are comprehensive for traders and investors to build systematic and discretionary models in trading the Corn market. We have provided an in-depth breakdown of the components and moving parts to trading the Corn market in this report.
Useful Links
https://futures.stonex.com/blog/what-you-need-to-know-about-trading-corn-futures
https://www.extension.iastate.edu/agdm/crops/html/a2-60.html
https://aaec.vt.edu/extension/va-commodity-market/grainhedging.html
https://aaec.vt.edu/extension/va-commodity-market/grainhedging.html
https://commoditychallenge.com/learn/assets/AAGM/AAGM-Chapter-14.pdf
https://www.agweb.com/opinion/how-delivery-process-works
https://www.morpher.com/blog/corn-trading
https://www.polarismarketresearch.com/industry-analysis/corn-market
https://www.ig.com/en/trading-strategies/what-is-corn-trading-and-investing-230213
https://www.ers.usda.gov/topics/crops/corn-and-other-feed-grains/market-outlook
https://farmonaut.com/blogs/corn-futures-market-analysis-navigating-price-volatility-and-export-trends-with-farmonauts-data-driven-insights
https://www.banglajol.info/index.php/BJB/article/view/68231/45891
https://www.agcountry.com/resources/learning-center/2024/commodity-factors
https://www.ers.usda.gov/topics/farm-practices-management/risk-management/risk-management-strategies
https://www.researchgate.net/publication/390262358_Price_factors_in_the_corn_market_technical_fundamental_and_seasonal_aspects
https://essfeed.com/the-largest-corn-importers-in-the-world-key-players-in-the-global-maize-market/
https://www.ers.usda.gov/topics/crops/corn-and-other-feed-grains
https://www.britannica.com/money/contango-vs-backwardation-differences
https://www.tradefinanceglobal.com/finance-products/grains/corn/
https://www.ncei.noaa.gov/access/monitoring/products/
https://www.barchart.com/futures/quotes/ZCY00/profile
https://www.cftc.gov/MarketReports/CommitmentsofTraders/index.htm
https://www.cmegroup.com/market-data/cme-group-benchmark-administration/cme-group-volatility-indexes.html
https://www.igc.int/en/
https://www.ams.usda.gov/market-news/grain
https://www.climate.gov
https://www.usda.gov/oce/commodity/wasde
https://www.ers.usda.gov/topics/farm-economy/commodity-outlook/wasde-projections-at-a-glance