Research: Equity Market Analysis/Investing, A Full Guide and Model
A Global Model Approach to Stock Market Analysis & Investing

This is it, the long awaited guide to Equity market investing. Its going to be an in-depth guide, so brace up and let’s get into it.
One more thing, Merry Christmas in arrears to all my readers.
In order to not confuse you, I will be mixing my analogy across the US market and SSA market, to effectively cover the concepts and variables utilized in analyzing the equity market. What is more important to note is that, this is a framework and it can be applied to any country equity market, but the limitations that might persist is the available of data for certain variables.
Economic Analysis
The first step before investing or trading any country stock market, is to thoroughly understand the economy of the target country. I have written research on country analysis, although not sufficient enough, I still intend to build on them but as a foundation, utilizing the GILPTS model is sufficient enough to understand the position of the economy.
This framework aids in macroeconomic analysis, so go through it.
Systems: GILPTS Framework for Macro Analysis

Hello MetaMacro readers, I have been working on a broad macro analysis report, but I thought about writing on my macro analysis system/model before publishing any macro insights/analysis. On a high level, my approach to determining investment positioning ideas is through a top-down and most times a bottom-up approach. Top-down, being macroeconomic variabl…
However, the missing variable not accounted for in the GILPTS model above specifically for the equity market is Economic Data analysis of the various sector within the economy.
The analysis of the economic data aids in framing a macro view on the performance and expectations around a particular sector and/or industry, and it sets the foundation for deciphering where opportunity lies towards building a narrative and a bias for that particular sector before then drilling into specific company names.
Bloomberg terminal has a view called the Economic Surprises Monitor (ECSU) that enables you to see how the economic data is grouped by sector. The limitation here is that it is only available for United States, United Kingdom and Euro Area

The other alternative is to build your own model to track and group economic data by sector. The process for this is to evaluate the Economic Key Indicators of the target country using the ECST view on Bloomberg or Trading Economics Calendar. See below image for Kenya Economic Key indicators

From the above screenshot, it is obvious that the key sectors for Kenya are:
Retail & Wholesale Sector
Industrial Sector
Housing and Real Estate
Personal and Household Sector
Monetary Sector
If you dig into the Real GDP by Industry you can also see other sectors that I have not listed above. Once you have this, then proceed to Trading Economics to view all actively published economic indicators or alternatively use ChatGPT to list those indicators for you(might not be accurate). The other alternative is to use an Economic Calendar and view all economic releases throughout the entire year, export it and remove duplicates. Here is what I mean:

With the above steps, you are able to build a database of economic data, even if you do not have access to Bloomberg Terminal.
The key takeaway is to be able to have your model for economic data, surprises, the difference and perhaps market reaction as this helps in framing the narrative across each sector
Once you are able to build your narrative and bias from the economic analysis, the next step is to perform a broad market analysis.
Broad Market Analysis
The analysis of the broad market involves majorly 3 steps, although 4.
The Stock Market Index
Index Analysis
Equity Factor Drivers
Volatility
The Stock Market Index
Before delving into sector analysis or fundamental analysis, it is crucial to first understand the index of the market itself, and the process to this is understanding how the index is constructed and its respective weightings.
On Bloomberg, you can use the MEMB function to view the Member Weightings of the stock index. Below is the member weighting of the S&P500, the Information Technology has the highest weighting (28.8%), then the Financial, Health Care and Consumer Sector. If you do not have access to Bloomberg, this information can be found online, just do the research.

The reason why you should start the broad market analysis form here is to be able to decipher the driver of the index performance, such that if the heavily weighted sector are underperforming or from the economic data analysis you develop a bearish outlook in the top 3 heavily weighted sector odds are the S&P500 index will trend lower. However, the other reason we need to identify this is to be able to perform an attribution analysis towards identifying the driver of price movements in the index.
It is important to evaluate the index weightings as they often change with price movement.
Below is the Nigeria 30 Index and its member weightings by Sector:

We can drill down further into the member weightings by Industry:

And lastly, a list of member weightings by Industry on the Nigeria All Share Index:

Below is a case study illustrating why you should conduct index analysis through the use of ratio analysis:
The Nigeria All Share Index (NGXASI, Red) has been rallying continuously in July, however, MTN Nigeria Stock contribution to that rally has been declining all through July into December’23. While, AIRTEL Africa contribution to the rally had declined in July'23, it eventually bottomed in September’23 and started to contribute positively to the NGXASI rally -
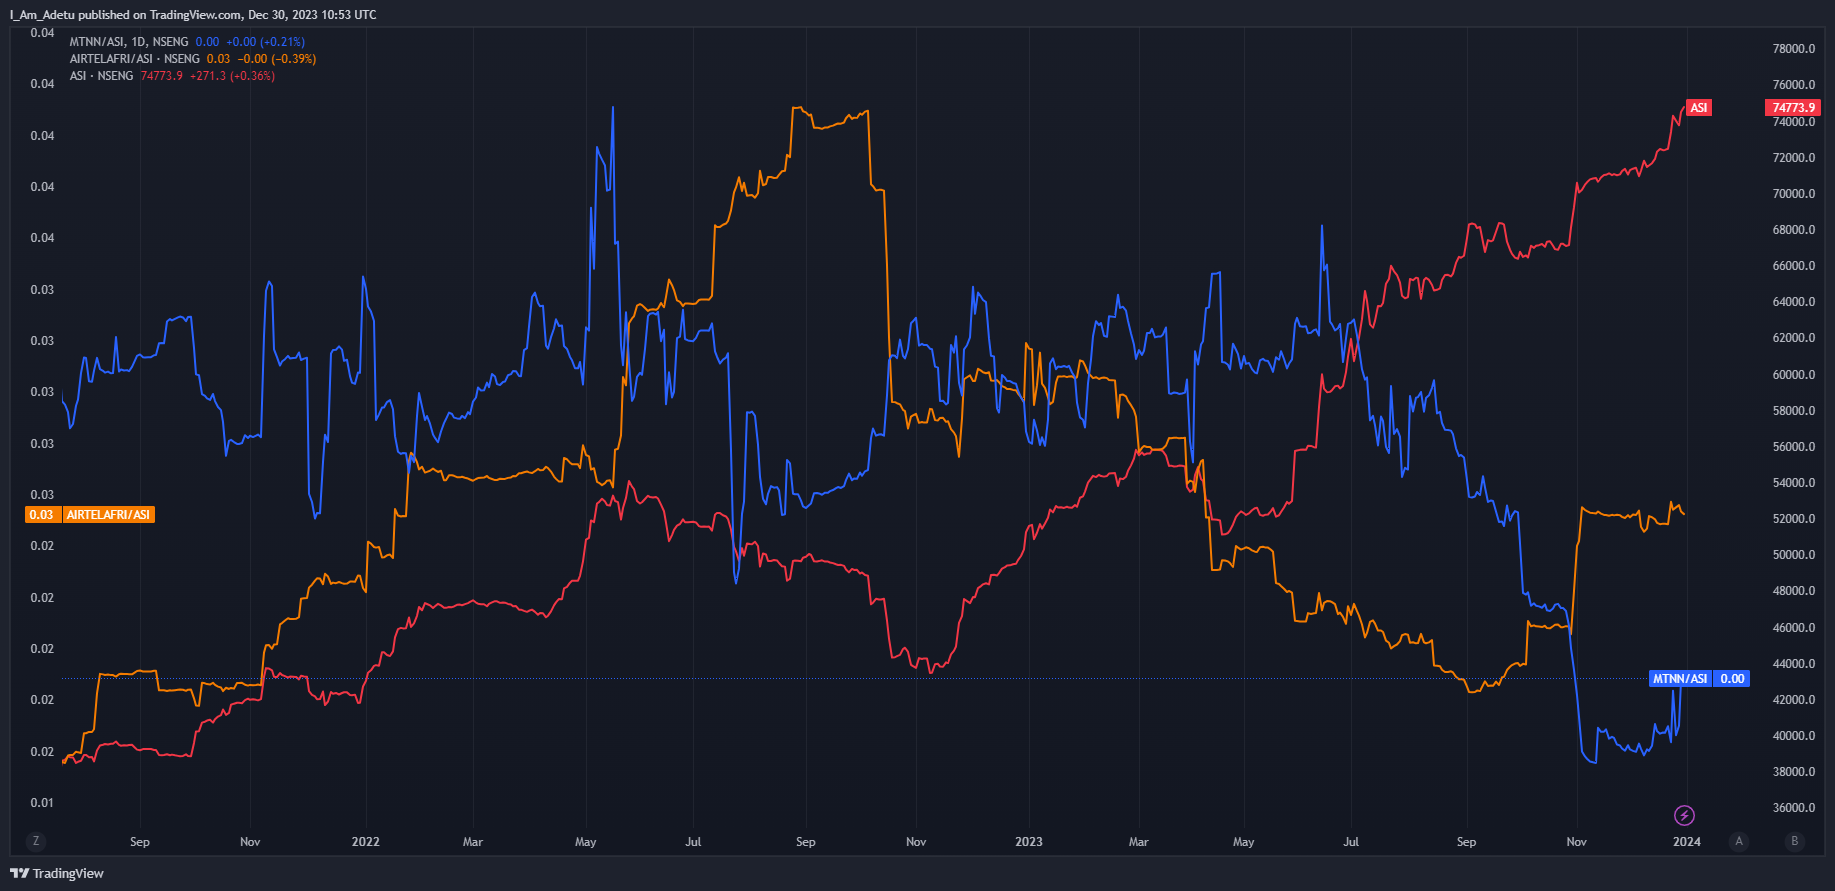
Evidently from the analysis of the index, its member weightings and ratio analysis, the better trade was to buy and hold AIRTEL Africa as against MTN Nigeria Stock. This same analogy applies to any stock market globally.

The key takeaway is to understand and analyze the members of the index, their weightings and continuous contribution to returns or loss in the index.
It is also important to note that there are sub-index within the main index, and the same analogy apply to them.
Index Analysis
While I had performed a bit of an index analysis in the previous section (the ratio analysis) this section involves the series of analysis to perform with an index.
Index Valuation
The index valuation function evaluates various valuation multiples and their trend for the Price to Earnings, Price to Sales and Price to Book Value ratios, coupled with a moving average.

The importance of this view at least for me, is to evaluate the factors driving price appreciation within the index from a valuation perspective. Evidently, we can see a decline in P/E ratio but a strong rally in P/BV ratio and P/Sales ratio.
How to utilize this is to then pick sectors of stocks that fits into the use of that valuation metrics, for P/BV these are majorly banking stocks, which sorts of puts a factor into why Banking names have had a bad time in 2022 and a good time in 2023.
Have a model that groups stocks based on their valuation ratio, and continuously assess what is driving interests in an index based on the index valuation.
This obviously shouldn’t be used in isolation as a signal alone
Index EPS Yield, Earnings Expectation Yield and T-Note Yield
I have had to construct a custom indicator for the Index EPS Yield and Index Earnings Expectation Yield, so you might not find it publicly available for each stock market index especially for SSA and other emerging markets.
EPS Yield = 100 * Bloomberg Estimate of EPS of the target Index / target Index
Earnings Expectation Yield = 100 * Sum of the most recent 12 months EPS of the target Index / Price of the target Index
It might be difficult to construct this manually based on available data.

The EPS Yield basically tracks the return on investment of the stocks within the index. Rising EPS Yield also implies that the return on investment is attractive and vis-à-vis when falling.
The Earnings Expectations Yield tracks the markets anticipation of earnings growth. Rising earnings expectations implies that investors expects the index or stock to experience an increase in earnings.
One key thing to note is that, this isn’t an indicator for immediate executable signal it is a lagging indicator when compared to price itself.
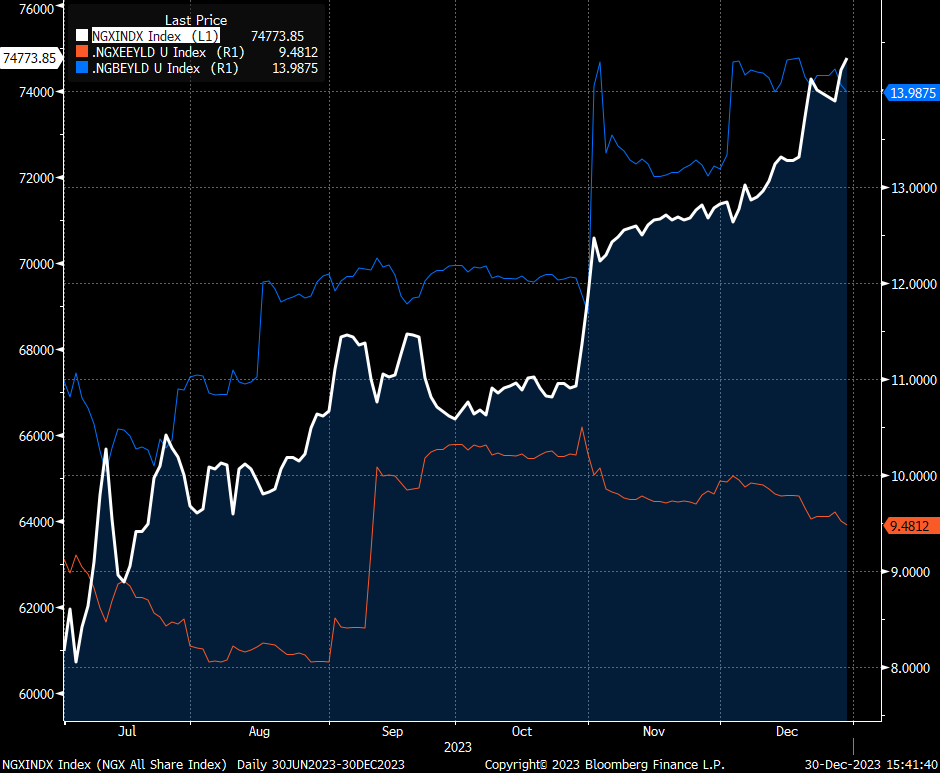
In the last 6 months of 2023, between July and October, we saw increasing earnings yield (blue), which also coincides with higher prices in the NGX ASI and buying interests, however, future earnings expectations (orange) made a top in October.
Subsequently, in November’23, earnings yield made a top while future earnings expectations are declining. Before we have a turning point in price, we would have to see the development of an inflection point in earnings yield and future earnings expectations as seen in late April’23 below, where earnings yield started to decline coupled with declining future earnings expectation, at this point we saw the NGX ASI bottom and reversed in May’23 resulting in the Bullish cycle we are basking in. This illustrates how the indicator lags, but with the right narrative and context, you could time it.

I excluded the T-Note yield, basically the goal of including the T-Note yield is to examine how rates in the bonds market are impacting movements of the asset price, it does provide additional context, so throw it in there.
Index vs Economic Surprise Index vs Earnings Surprise
The ECSU function on Bloomberg provides a broad view on Economic Surprise release, down to the sectors, both only for US, UK and the Euro Area.

I think the way to track this for every country you are actively investing in, is to build excel models that tracks the release of economic data over time for a particular indicator and grouped by sector. I know, this might seem difficult, but I have models tracking economic data that I simply update.

For the EPS Surprise Index(blue) below, I managed to build one on Bloomberg for the Nigeria ASI. In 2023, we saw increased EPS surprise in Q3’23, also, when EPS Surprise remained flat in September 2022 through March, we saw the NGX ASI decline and eventually bottomed in late November 2022:

You might have to track this with an excel model. But the data is readily available for Advanced Economies.
If the economic surprises are continuously trending higher, this implies that investors have a positive view of the stock market/economy and thus the price of stock rallies, and below chart of the S&P500 shows the relationship between Economic Surprises and the price of the SPX index

The key takeaway here is to be able to examine what is driving stock performance especially from an economic data point of view.
Additionally, the other variable to track is the index to sales surprise.
Equity Factor Drivers
The aim of preforming the equity factor driver analysis is to understand the factors driving stock appreciation, more particularly, what factors investors are pricing into the market. These factors include:
Volatility
Index Value vs Growth
High Dividend vs Low Dividend Yield
Quality vs Junk
Share Buy Backs
Short Interest and Open Interest Levels
I would like to iterate that I have intentionally not focused more on the advanced economies, as the chart illustration are more of the emerging markets and developing economies due to their limitation in data availability. If you can figure them out, you have a high likelihood of figuring that of the advanced economies, as long as you understand the concept.
Bloomberg has a Factor to Watch(FTW) function that accounts for the Long-Short Total return. Below is the FTW for Value stocks and the SPX Index, essentially, when FTW Value is declining and SPX Index is rallying, it implies that the buying interest isn’t heavy on value stocks but the rally is driven by other factors outside of value stocks.

Over the year, the best performing stocks are Growth and Liquidity stocks within the S&P500

The fundamental idea behind Factors to Watch is to build an index based on each factor and compare with the overall stock index, to evaluate what factor seems to be driving the overall market positive return and negative return/under-performance.
Below is the Factor Matrix via the TLTS function on Bloomberg, this view essentially aid in identifying how investors perceive a stock whether it is a Size, Value, Dividend, or others driven stock, all based on the Factor to Watch (FTW).

Compared to the NGX ASI Index, Dangote Cement is more perceived as a Size stock when it comes to FTW, while FCMB is considered more of a Value stock. If you apply this segmentation across all members of the NGX ASI Index, you easily get a view on what Factor is driving market movement.
The key takeaway here is to be able to identify what factor is driving price movement and studying how the factor rotates across board
I hope I haven’t lost you, yes it might be a lot to take on, take your time.
Sector Analysis
Once you are able to complete your index analysis, you would have been able to develop a narrative, a bias and the sector to focus on. Then, you can drill down on the models for sector/industry analysis.
I can’t cover all the sectors in the market in this article and at the same time provide a model for analyzing them, so I will skip this section and provide a write up sharing the framework for certain industry separately.
But the take home here is to be able to perform a sector analysis and have a go-to framework for analyzing any sector or industry.

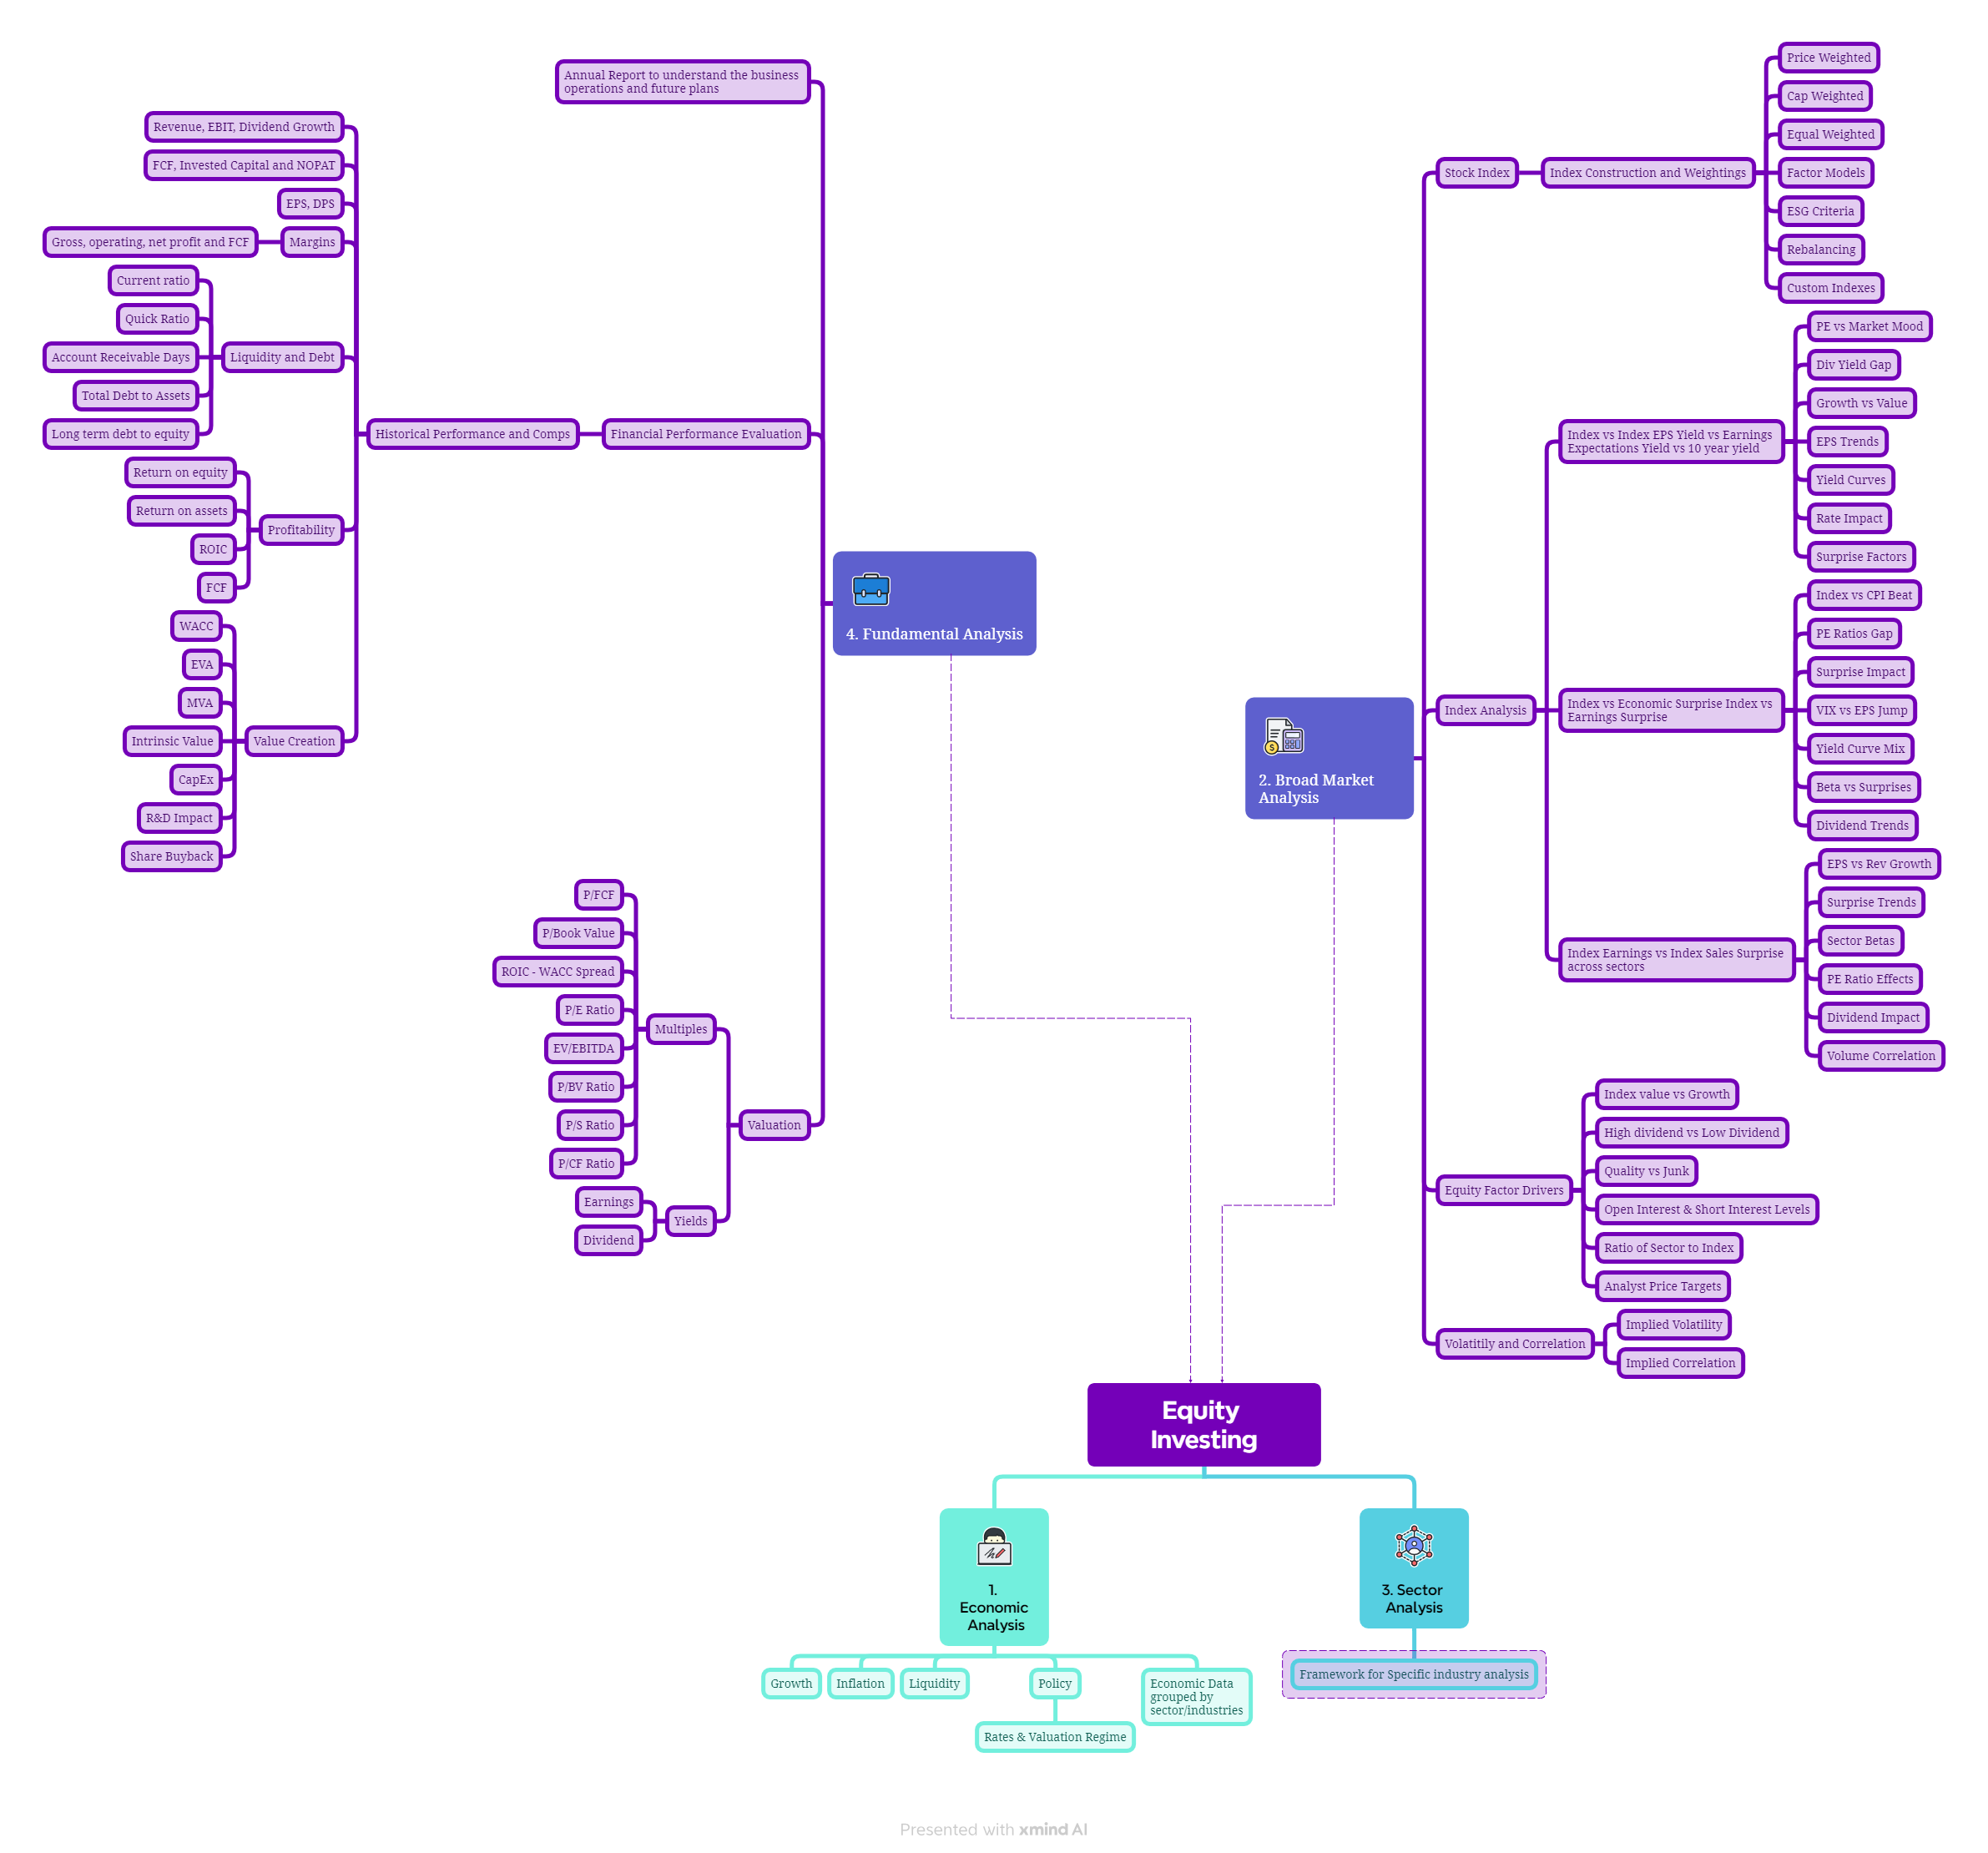
Fundamental Analysis
Once you are able to complete your sector analysis, then you can drill down on stock selection and its fundamental analysis.
The process of fundamental analysis is divided into three stages:
Annual Report Review with the aim of understanding the business, its operations and future plans
Financial Performance Evaluation
Valuation
Financial Performance Evaluation
The idea is to keep things as simple as possible, the focus on performance evaluation is to evaluate the historical performance of the target stock and also perform comparative analysis with comparable companies based on their factors and industry grouping.

All the variables you need to analyze are in the above image, in order to develop a full picture of the financial performance of the target stock. In future article, I will be applying some of the above in real-time.
Valuation Metrics
The other component of fundamental analysis is evaluating the valuation metrics of the target stock and its comps

By performing all of the above laid down process, you have a relatively high probability of picking a winner and perhaps a loser also.
Conclusion
Conclusively, the idea isn’t to perform every step and every process in here before building a narrative or bias, the broad idea from me to you is having a model, a framework toolkit, that you can pick pieces from to formulate your own model towards approaching any equity market.
There is more to come.
Have a wonderful weekend and a happy new year in advance.